Like millions of people around the world, you probably use your PC to play video games. You may well have lots of experience of building and configuring computer systems, as PC gamers are often knowledgeable and enthusiastic when it comes to hardware. So how about combining all three? Take the computer know-how, the love of games, and the interest in components, and mix them all together. It’s a perfect recipe for diving into the workings of a PC and seeing how well it performs.
In this article, we’ll explain how you can use games to benchmark your PC and what you can do to analyze the results — either to check the overall performance or to see what part of your computer is doing most of the work. We’ll cover the best way to go about collecting the data and how to use the tools that we run with to check out the latest hardware. Time to get a-testin’!
It’s more than just a game
When we took a look at 20 programs to analyze and benchmark your hardware, some of those that specifically test 3D graphics performance provide in-depth charts for the performance and offer monitoring tools to log how the various parts are operating. But as good as these programs are, they’re ultimately an artificial setup: we don’t play benchmarks. We don’t buy $2,000 machines just for them to run testing programs all day long (well, most of us don’t).
But if you have a bunch of games installed on your system, you can easily use them instead — the latest titles often push the CPU and the GPU to their absolute limits of what they can do, so they give your system just as good a workout as any benchmark program.
Quite a few titles also have their own built-in test mode. Ubisoft’s latest titles in their popular franchises can run a set test, and then display the results in quite a lot of detail. In Assassin’s Creed Odyssey, for example, the tool is advanced enough that results can be compared to a previous run, so you can easily see what impact any changes to hardware or the game’s settings have produced.
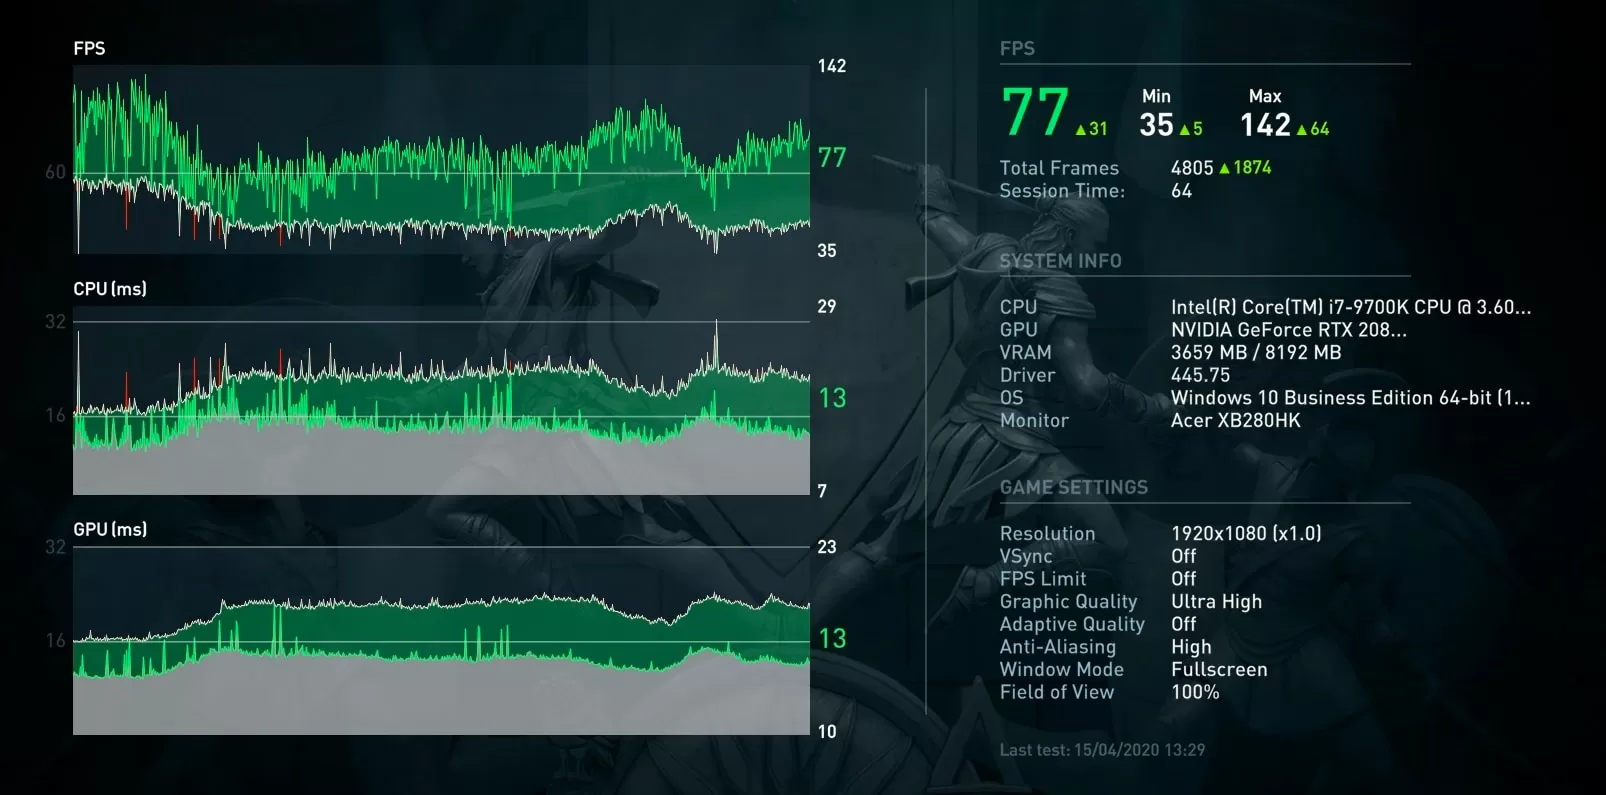
In the above image, we can see 3 graphs: the frame rate, how long it took the CPU to process each frame for rendering, and the time it took for the GPU to work through a frame. There’s some basic statistics, too, with the average (the arithmetic mean) and the absolute maximum/minimum figures shown.
For games with benchmark modes, or ones that can display frame rates while playing, the simplicity of these statistics is the first problem with using such features in games. Absolute values might only occur for a single frame or that figure might be hit multiple times, at regular intervals. If the results can be viewed in a graph, then this is easy to see, but if all you get are the numbers, then the figures themselves are near useless.
Another potential issue with using a built-in test, is that the workload placed on the CPU, GPU, etc. might not be indicative of what you might see during actual gameplay. The background processing of input variables, path finding, audio tracks, and so on will be missing, and the rendering might not have things like explosions or other particle effects, which can often bring a graphics card down to its silicon knees.
If you just want something to quickly check out your system with, though, these kind of tests and the numbers they collect are good enough. On the other hand, if you want to test what the PC is doing when its going through real workload, then you’re better off logging data in the game itself — and for that, you need to use the right tool for the job.
Choose your weapon!
There’s a reasonable number of programs, all freely available, that can be used to record how quickly a 3D game is being processed. For Windows systems, MSI’s Afterburner and FRAPS, are two of the most popular. The former is a comprehensive tool for adjusting the clock speeds and voltages of graphics cards, and works on AMD and Nvidia models; it can also display this information, along with temperatures and frame rates, in an overlay when playing games (all of this data can be logged, for later analysis).

FRAPS can also display and log frame rate, as well as capture video output and take screenshots, but it hasn’t been updated since 2014. It’s best used on older titles, that use Direct3D 10 or earlier, but given that Afterburner covers this, too, as well as the latest games, it’s probably only worth using this, if nothing else works.
We actually prefer using a tool called OCAT (Open Capture and Analysis Tool): it’s made by AMD, as part of their GPUOpen project, an initiative designed to give developers access to a range of free software tools and code samples. OCAT utilizes Intel’s PresentMon, which is also open source.
Both tools are in constant development, so you will occasionally come across a glitch or two, but for displaying and logging frame rate data in Direct3D 11, 12, and Vulkan-based games, they’re very good at what they do. Nvidia also offers FrameView, which does the same thing, but it’s not open source. Lastly, there’s CapFrameX, which also logs a wide range of technical data, but its best feature is the comprehensive tool kit for analyzing the data and presenting the statistics.
Like Afterburner and FRAPS, OCAT offers an overlay function, where the frame rate and frame times are displayed.

When running, the overlay displays what graphics API is being used and can show the changes in the frame rate via a little graph. This can be somewhat hard to see, so it’s not worth using it.

Other tools, like Afterburner, offer more a lot more detail in their overlay systems (clock speeds, temperatures, etc), so if you just want to monitor what’s going on with your PC, while you’re playing games, OCAT doesn’t give you very much. However, we use it because it captures a lot of critical information, and then process and analyze it for us.

To do this, set a hotkey for the capture process (make sure you pick one that the game doesn’t use) and, if you need to, select where you want the data to be saved. It’s a good idea to limit the capture time to a fixed value, but we’ll look at this in a moment.
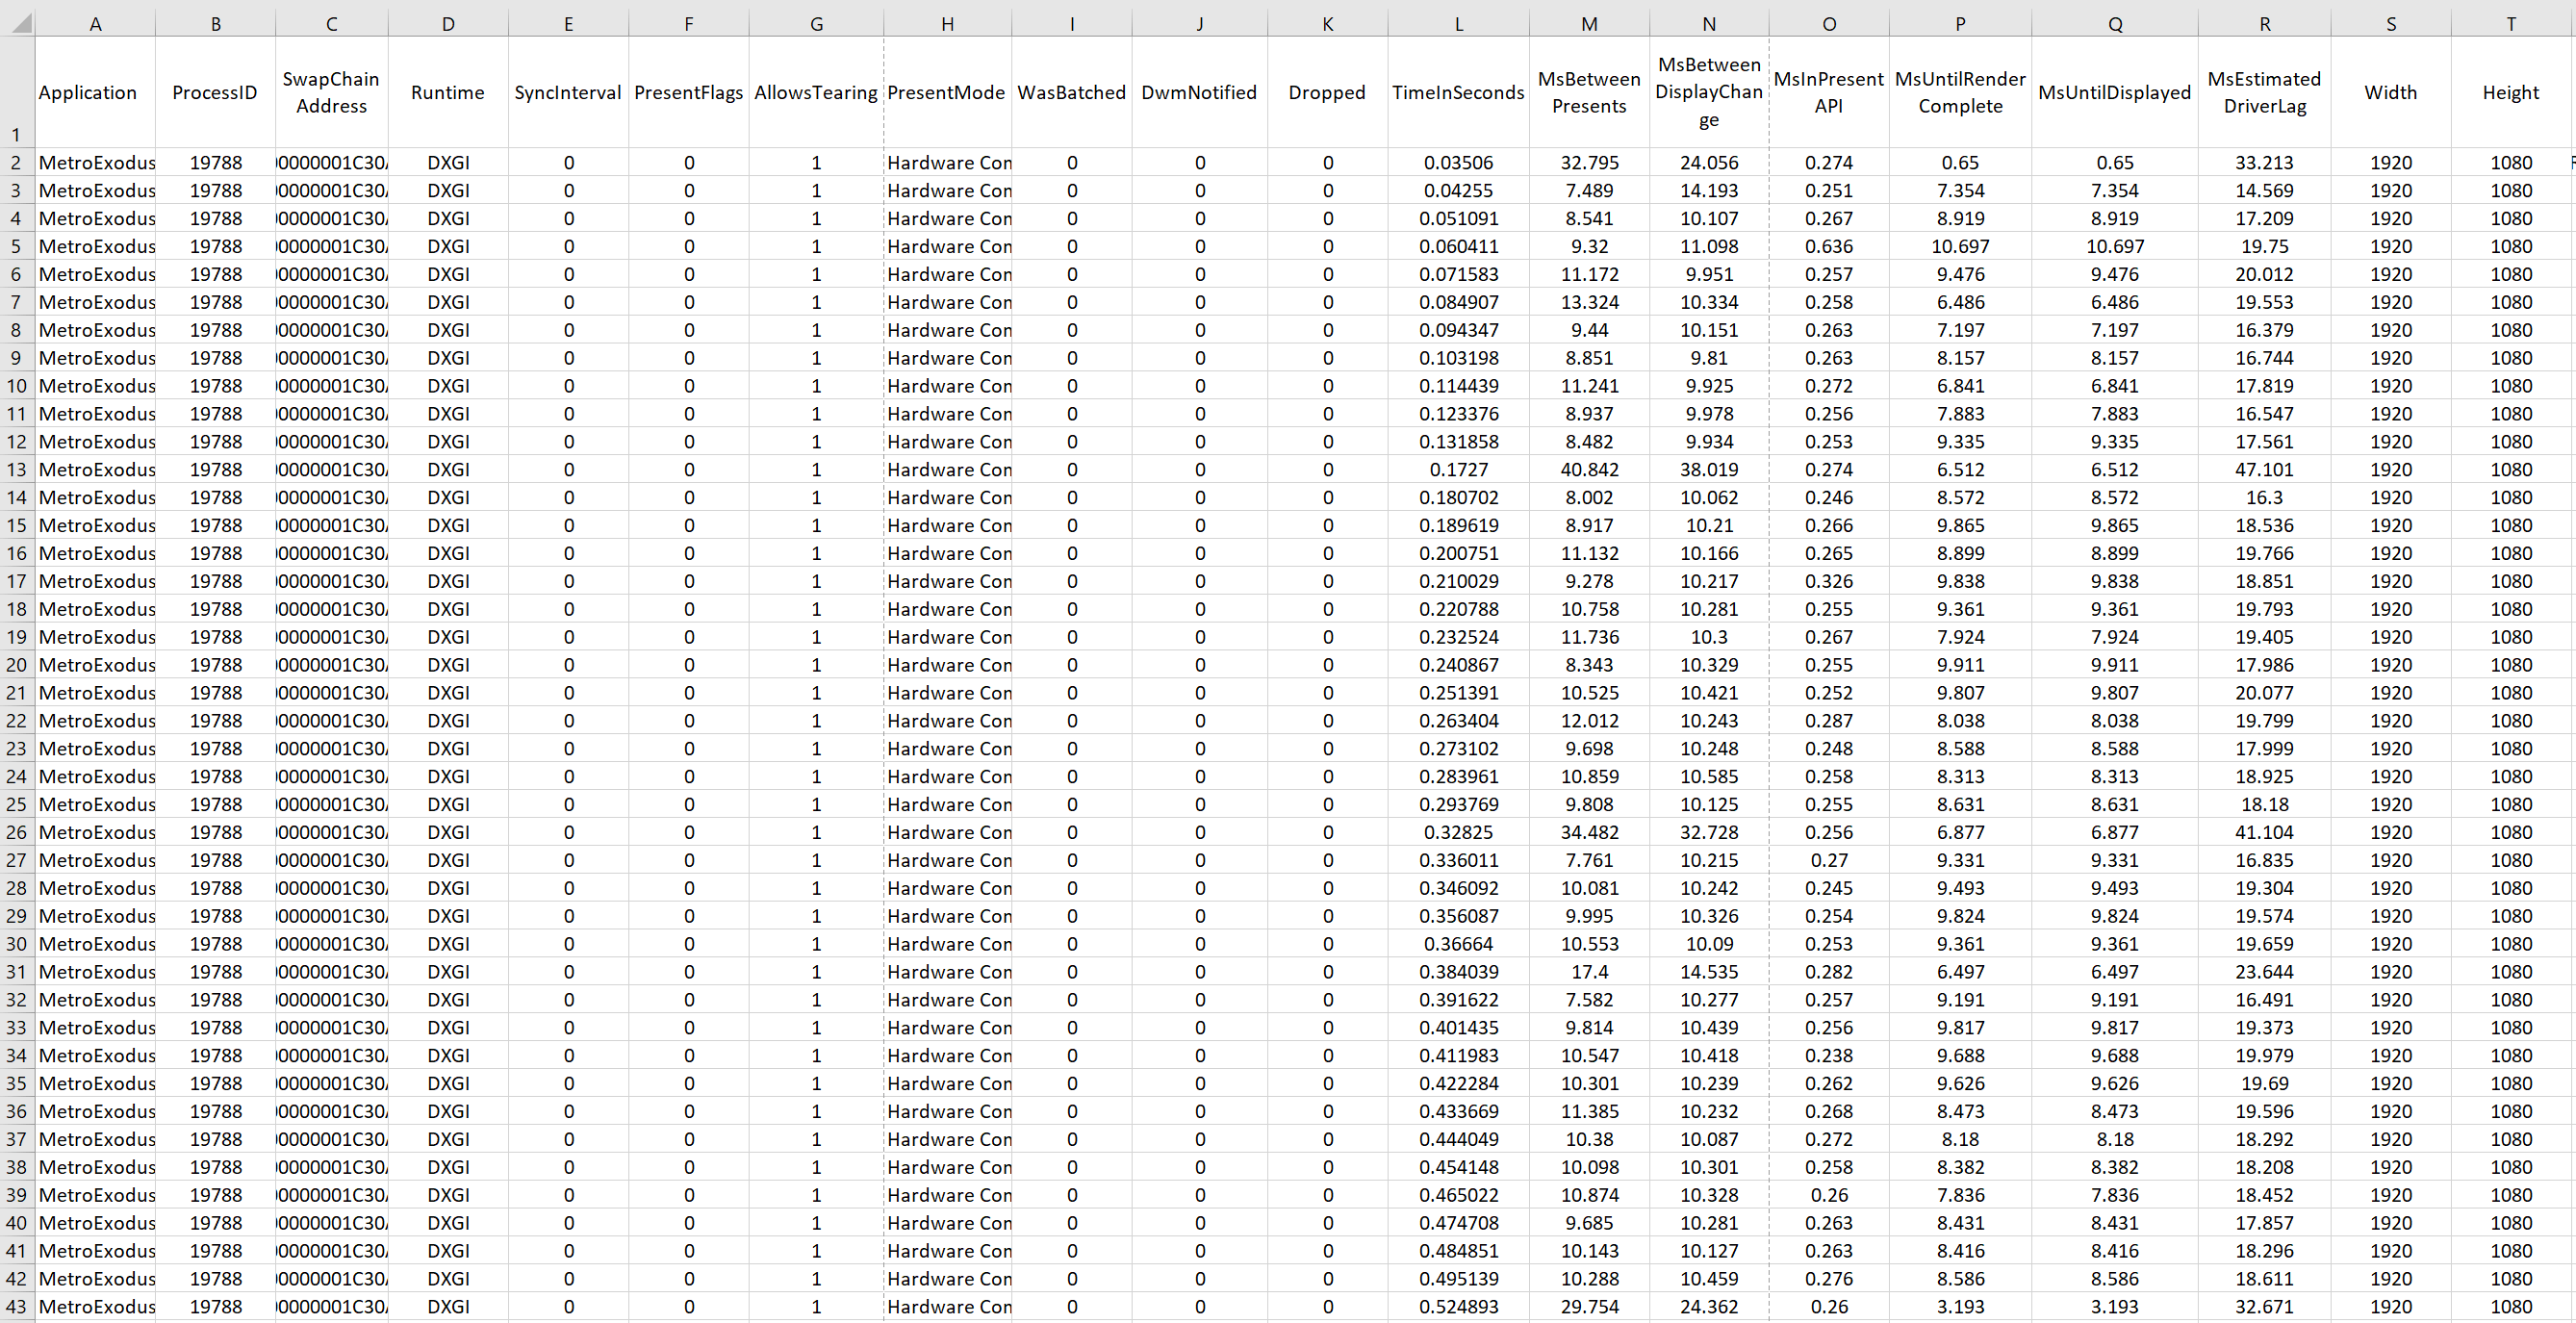
The results are stored as a .csv file (comma separated values), so you don’t have to use OCAT to go through the data — Microsoft’s Excel, Google’s Sheets, Apache OpenOffice, etc. can all easily handle this format. Just a word of warning though: the file contains a lot of data, and easily grind up your PC when trying to work through it all.
Using it is very easy – start OCAT first, then fire up the game you’re going to test with, and press the Capture hotkey once you’re in gameplay. If you haven’t set a time capture limit, you need to press the hotkey again to stop recording.
Note that when you start and end the capture, there is often a momentary drop in the game’s performance; there’s not much you can do about this, but at least it only affects the results for a handful of milliseconds.
To utilize or not to utilize — that is the question
So that’s the logging of the frame rates covered, but what else is worth recording? A question that you often see on forums about PC hardware is ‘does my CPU bottleneck my graphics card?’ or vice versa, and the responses regularly talk about monitoring CPU and GPU utilization.
You can log such data using HWMonitor or Afterburner, but it’s worth knowing exactly what the utilization % figure actually refers to. Roughly speaking, it is a measure of how long threads in a kernel (sequences of instructions in a block of code) are currently being processed by the CPU/GPU, as a percentage of the time allocated for that thread (checked per second or other time interval).
Threads might be being actively worked on (‘busy’) or waiting for data from cache/memory (‘stalled’) or finished (‘idle’). Busy and stalled threads get classed in the same way, so a high utilization figure does not necessarily mean the processor is being worked very hard, and the % value doesn’t tell you how much of the processor’s capabilities being used.
We can see this by running two different GPU benchmarks, and logging everything with HWMonitor. The first test is with Geekbench 5, which runs through a series of compute routines, all done on the graphics card.
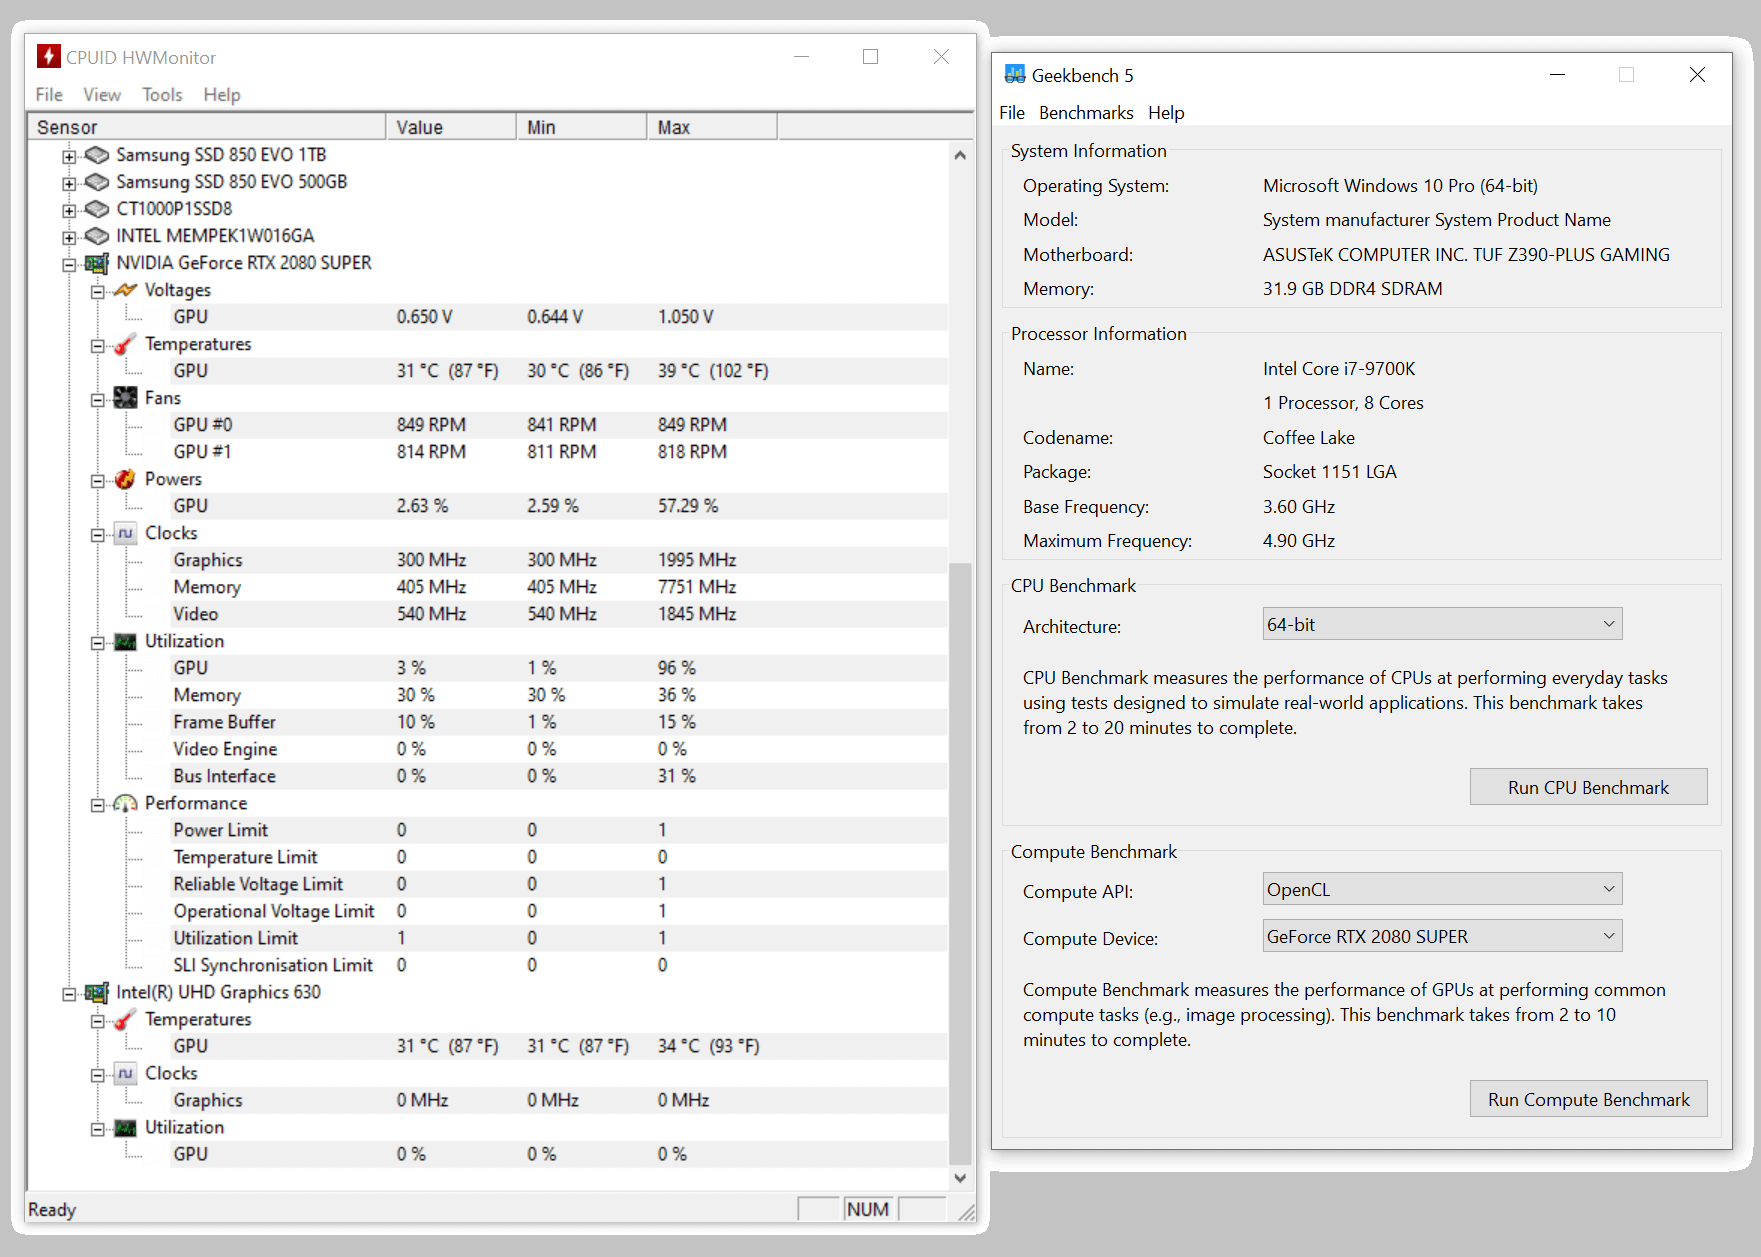
If we look at the Max column in HWMonitor, the GPU utilization peaked at 96% – but pay close attention to the power value. This hit a maximum of 57.29%, which for this particular graphics card, equates to around 140 W of electrical power. Also note the temperature of the GPU rose just 9 degrees above the minimum recorded.
Now compare that to using a program which is designed to really stress the graphics card. We used OCCT but you could use a graphics benchmark or a game set to maximum detail levels.
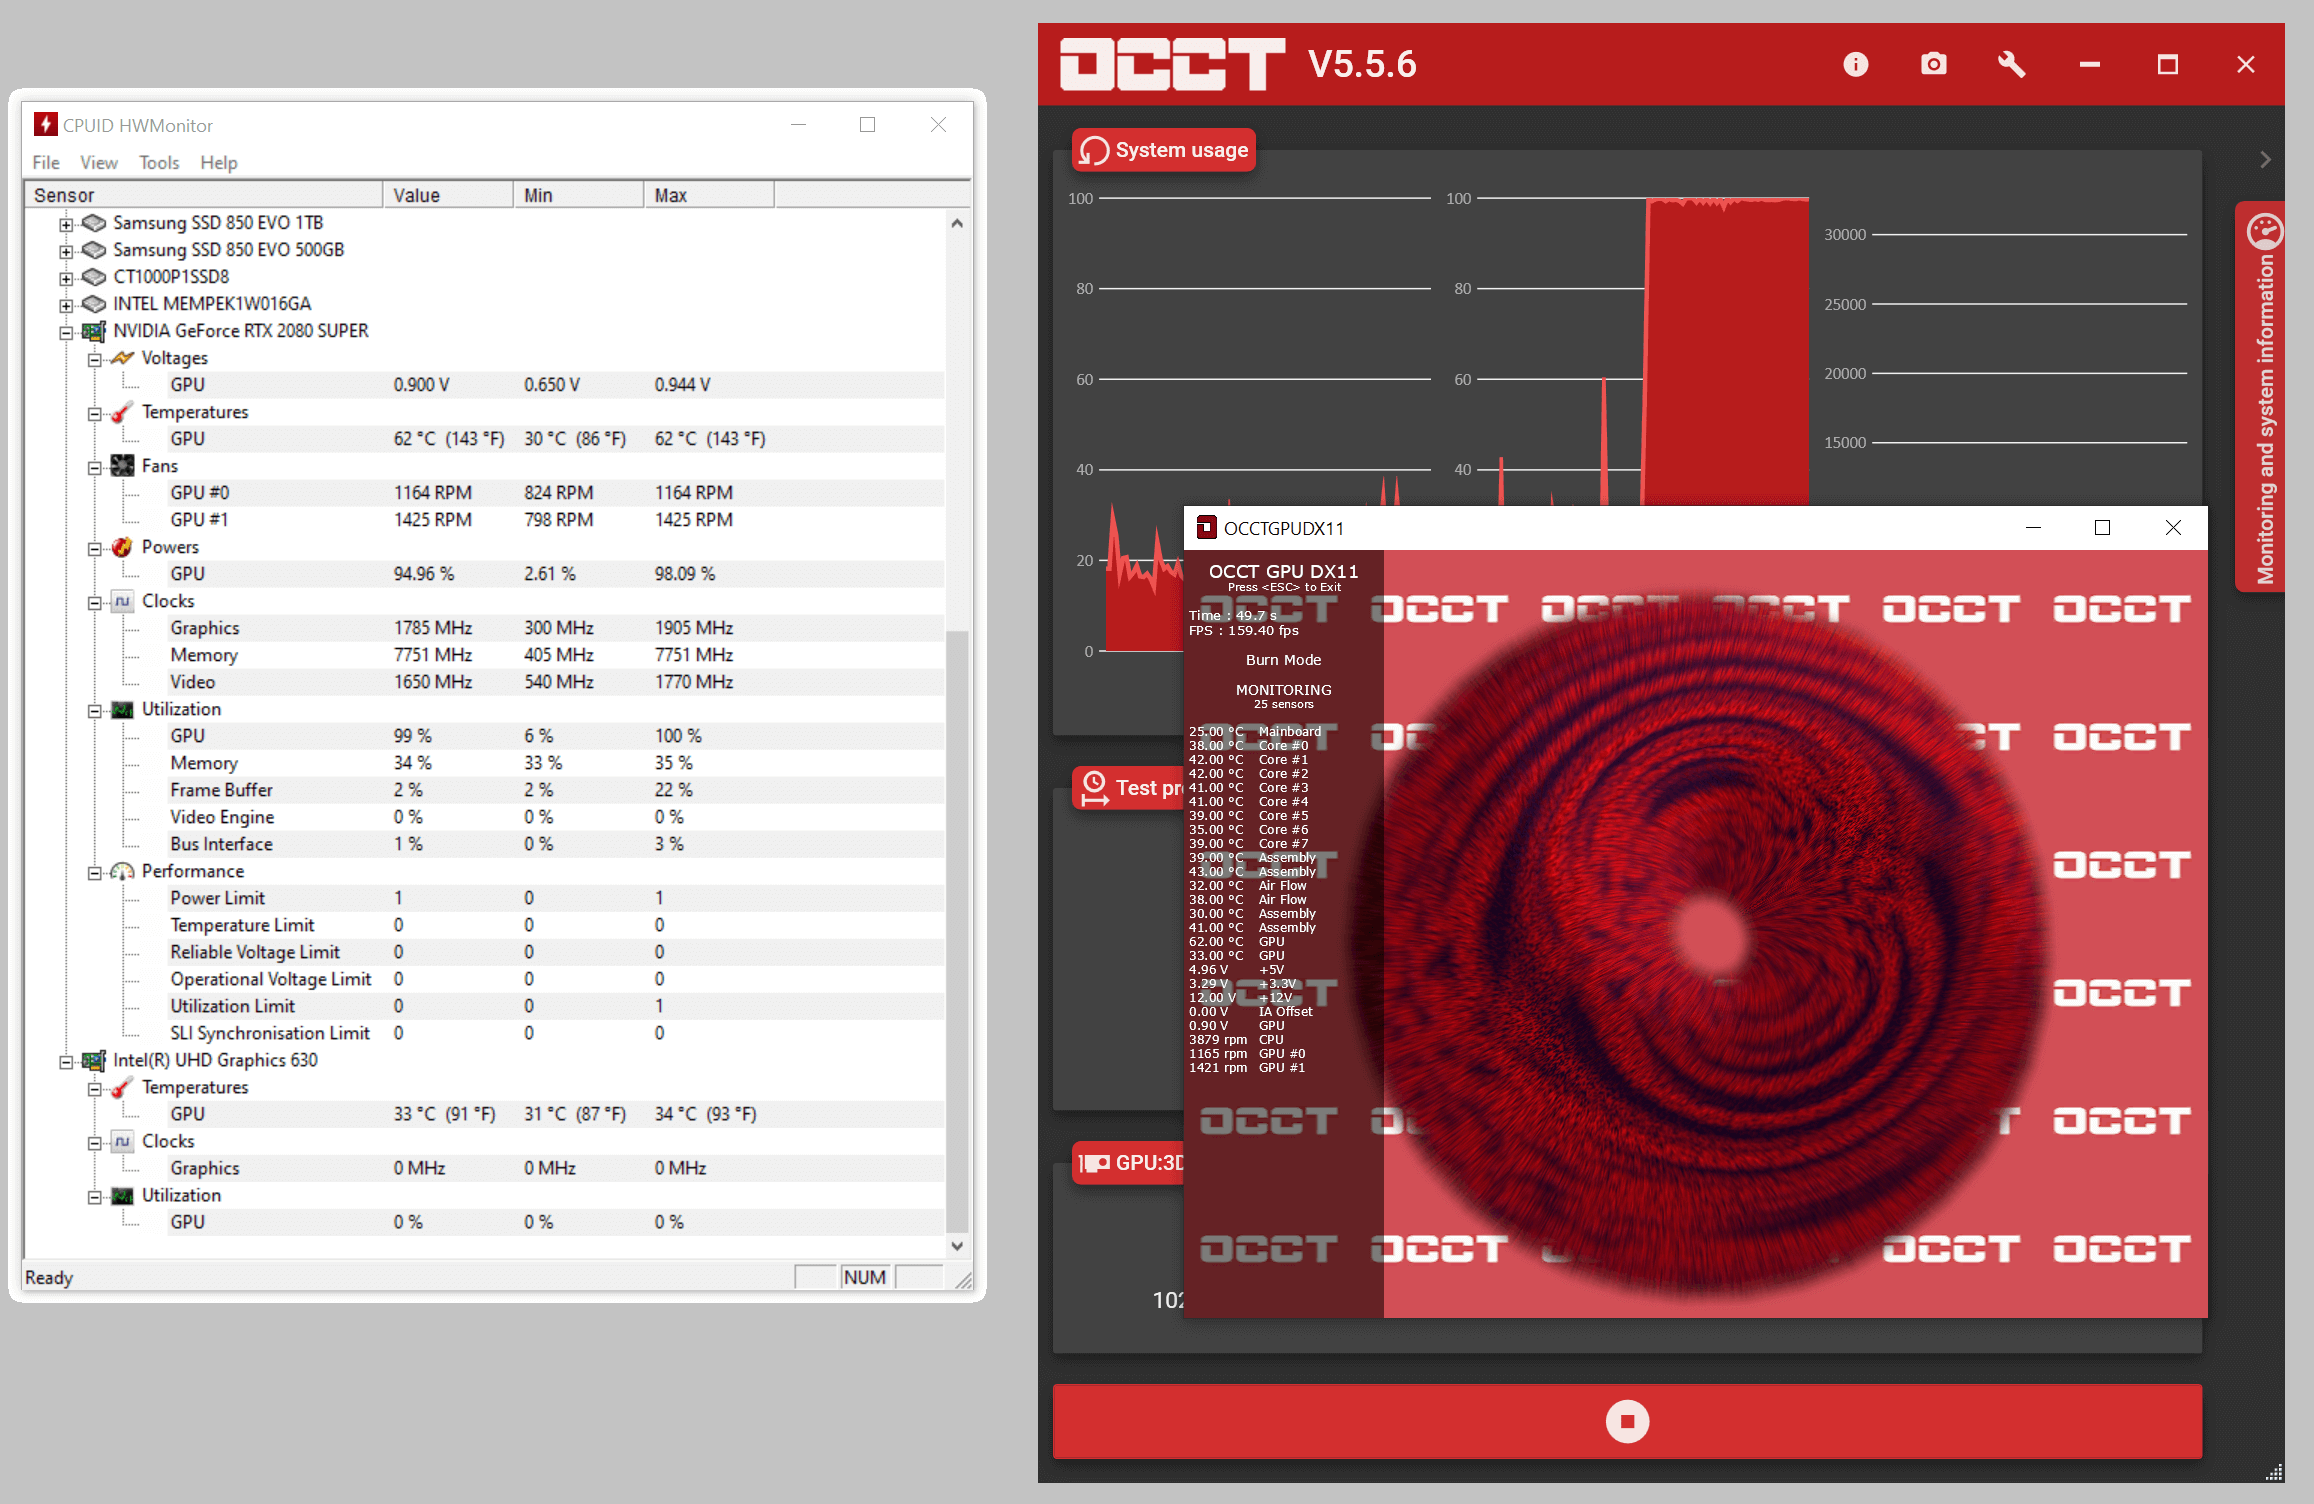
This test resulted in a 100% utilization figure, only 4% more than in GeekBench 5, but the power and temperature values are much higher — the former being over 100 W more than in the previous test. Together they show that the GPU was being worked far more thoroughly than in the previous benchmark, and this is something that’s not obvious from just looking at the utilization value.
Logging power can be a useful way to analyze the workload the components are under. The image below displays the CPU, system memory, and GPU power values while running two sections of the Time Spy Extreme benchmark in 3DMark – the one on the left is the CPU Test, the right is for Graphics Test 2.

We can clearly see that the GPU is doing relatively little work for the CPU Test, whereas the central processor is being hit hard (as expected, but note that the RAM is being worked, too). Then in the test designed to push the limits of the GPU, the power consumption of the graphics card is full — yes, the CPU is still pretty high, but the GPU power % tells us that it’s doing a lot of work.
But is it doing all of the work? How can we be certain that the CPU isn’t actually affecting what’s supposed to be a graphics-only test? The simple answer is: we can’t tell, not by just looking at utilization and/or power figures.
So while there’s nothing wrong with logging this information, there are better ways of determining how hard the various components are being used. And while we’re looking at what data is worth collecting, let’s have a look at what OCAT is doing under its hood.
What is actually being logged to get the frame rate?
To understand what data the likes of OCAT is collecting, you have to know a little bit about the rendering process in a 3D game. You can read a brief introduction on the subject, if you’re interested, but we’ll let Nvidia gives us the overview with this diagram, from the documentation in FrameView:

For each frame that’s going to be created by the graphics card, the game’s engine works out all of the data and instructions needed to be issued to the GPU. One particular instruction, in Direct3D, is called Present – this tells the processor to display the frame once it’s finished rendering it.
Any game or program that displays the frame rate measures the time interval between successive Present instructions. In this gap, several things take place:
- The graphics API (Direct3D, OpenGL, Vulkan, etc) converts the broad instructions from the game engine into a more detailed, complex sets of algorithms
- Then the graphics card driver then converts these into the various codes for the GPU
- Next, the GPU then works through all of the code and then flags the completed frame ready for displaying
- The output part of the GPU then sends the image to the monitor, when draws the frame during the next screen refresh
- And while that’s taking place, the game engine has already started, or even finished, preparing the next frame
So, the time between Present() instructions isn’t a measure of how fast the GPU is at rendering a frame, or not directly, at least. However, since this processing is nearly always takes much longer to do than everything else, it’s a pretty close estimation.
PresentMon, OCAT, and FrameView measure lots of different time intervals, multiple times per second, and saves them in the .csv file. We’ll look at this when we analyze some results later on, but these are the main times recorded:
| CSV Column Header | What the time interval is |
| MsInPresentAPI | The number of milliseconds that the code spent going through the Present() instruction |
| MsUntilRenderComplete | The gap, in milliseconds, from when the Present() instruction was issued to when the GPU finished rendering the frame |
| MsUntilDisplayed | The number of milliseconds from when the Present() instruction was issued to when the frame was displayed |
| MsBetweenPresents | How many milliseconds there were between the last Present() issued and the current one |
| MsBetweenDisplayChange | The time gap between the last frame being displayed and the current one getting displayed, in milliseconds |
When we show frame rates, in hardware reviews, we’ve used the MsBetweenPresents data; OCAT defaults to this automatically, and it’s the same figure that’s used by other logging tools and games, when they show frame rates.
But notice how these are all times: how does this get turned into a frame rate (fps = frames per second)? The calculation is simple, as there are 1000 milliseconds in 1 second, you divide 1000 by the Present time.
For example, if the value for MsBetweenPresents was a constant 50 milliseconds, then the displayed frame rate would be 1000/50 = 20 fps. So if you’re aiming for 60 fps or 144 fps, then the time interval will need to be 17 and 7 milliseconds, respectively.
Take the scientific approach to benchmarking
While benchmarking your PC isn’t quite the same as conducting particle physics research at CERN, we can still employ some fundamental aspects of the scientific method for data collection and analysis. The first part of this is to minimize the number of variables that can change and have an impact on the outcome of the test.
In an ideal world, you’d want the computer to be doing absolutely nothing more than running the game and the logging software — this is what we do when we test the latest hardware, as our test machines are used only for benchmarking. This might not be possible for most home computers, but there are some things you can do to help:
- Only have the minimum number of programs open for testing and monitoring
- Exit non-essential background programs, such as chat software or cloud services, like Discord and OneDrive
- Pause anti-virus programs or set them to block all network traffic
- Configure software updates or backup systems to time their actions to take place outside of when you’re benchmarking
The next thing to do is to ensure the testing environment is the same as that experienced during normal gameplay. This might seem like we’re contradicting ourselves, given what we’ve just said about reducing variables, but we’re referring to the fact that modern hardware actively changes clock speeds and operating voltages, depending on the temperature they’re running at.
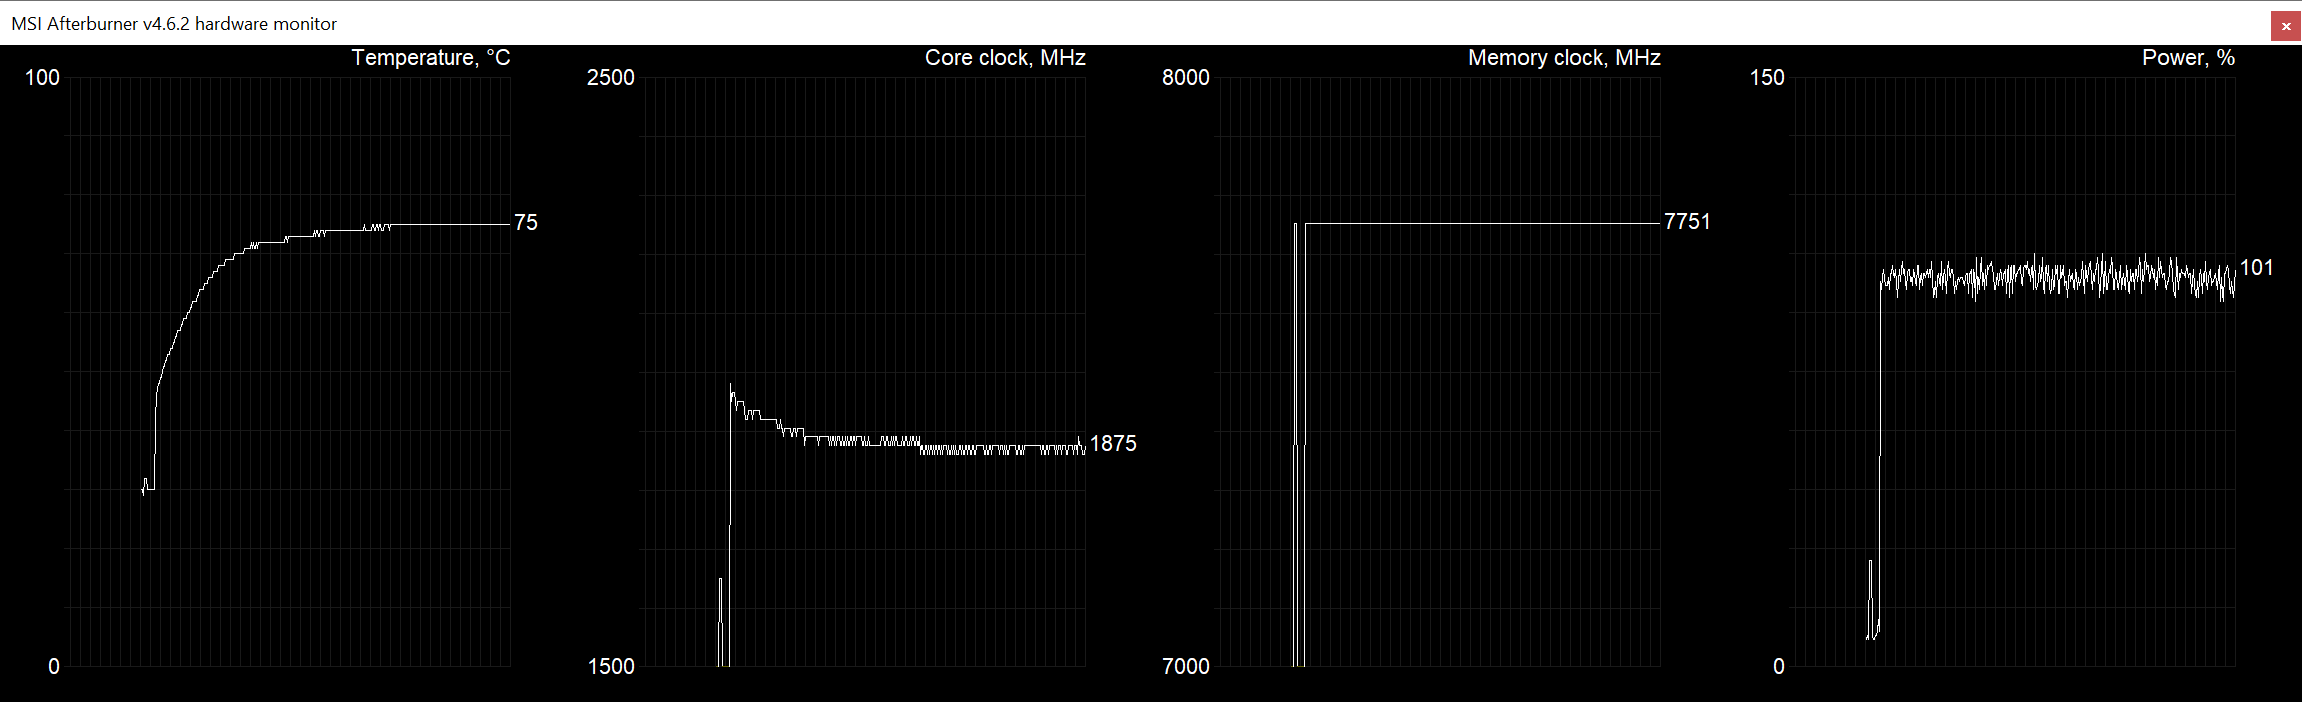
Graphics cards are especially prone to this, as the GPU can get very hot when working. Once they reach their predesigned heat limits, the hardware will start to lower clocks to ensure the chip doesn’t overheat. We can see this clearly in the above image: as the temperature of the chip has risen, so the clock speed has decreased to keep the heat levels under control.
Of course, this means the performance will decrease, too, but by pre-warming all of the key components in the PC (CPU, RAM, GPU), the clocks should be a little more consistent. The simplest way to do this is by running the game you’re going to test for at least 5 minutes, before you start logging any data.
Another thing to bear in mind is that, even with all the above precautions in place, test results will always vary. It might be down to the game you’re using, or it could some normally dormant background process, popping up to say hello. This is why it’s important to collect multiple sets of data — do several test runs, at least 3, so that an average can be calculated.
This is something that we always do in our hardware testing. Doing more than 3 is better, but doing something like 10, is unlikely to provide any benefit. This is because the variations themselves are usually quite small, provided the test environment is controlled, and once you have several thousand data, the odd rogue value isn’t going to have much of an impact on the statistics.
The last thing to consider is how much data to collect with each test run. The time allocated for logging needs to be large enough to be representative of what’s normally going on, but not so big that you’re just wasting valuable testing time. To demonstrate this, we took 3 samples of frame rate data using Ubisoft’s Assassin’s Creed Syndicate.

We picked a location in the game that allowed us to easily repeat the test and set OCAT to capture data for 10, 100, and 1,000 seconds. We’ll show you how we got the following numbers, and what they all mean, in a moment, but for now here are the results:
| Length of data collection | 10 seconds | 100 seconds | 1000 seconds |
| Mean frame rate (fps) | 59.8 | 60.0 | 60.0 |
| 1% Low (fps) | 33.8 | 54.0 | 54.0 |
| 99% High (fps) | 120.4 | 66.9 | 66.5 |
| Frame time standard deviation (ms) | 2.97 | 0.62 | 0.58 |
We can see that there is virtually no difference in the average frame rates, but the 10 second run is seemingly giving a much wider range in the rates (from 33.8 up to 120.4 fps). That same variation was probably in the other runs, but because they contain so much more data, the statistical impact of it is greatly reduced. This is what you’d get when playing games anyway — after all, who plays for just 10 seconds?
However, notice that the 100 and 1,000 seconds numbers are almost carbon copies of each other. So for this particular test, collecting data for over 16 minutes produced statistics no different than those from the run 10 times shorter.
Brought to you by the letter S and the number 1
We’ve mentioned the word statistics a few times now, so we need to move on to getting some data to analyze with math.
Let’s assume that we’ve already selected a game to test and captured all the data we need. We can now use OCAT to analyze the results for us, and to do this, head for the ‘Visualize’ tab:

Just click where it says ‘Select capture file to visualize’, select the .csv file needed, and then hit the ‘Visualize’ button. We did a quick test in Assassin’s Creed Odyssey, recording the various frame times from the game’s built-in benchmark; the test was set up to at 4K resolution, with the graphics settings on Ultra High.
By default, OCAT shows the MsBetweenPresents numbers over the duration of the logging in the form of a smoothed graph.
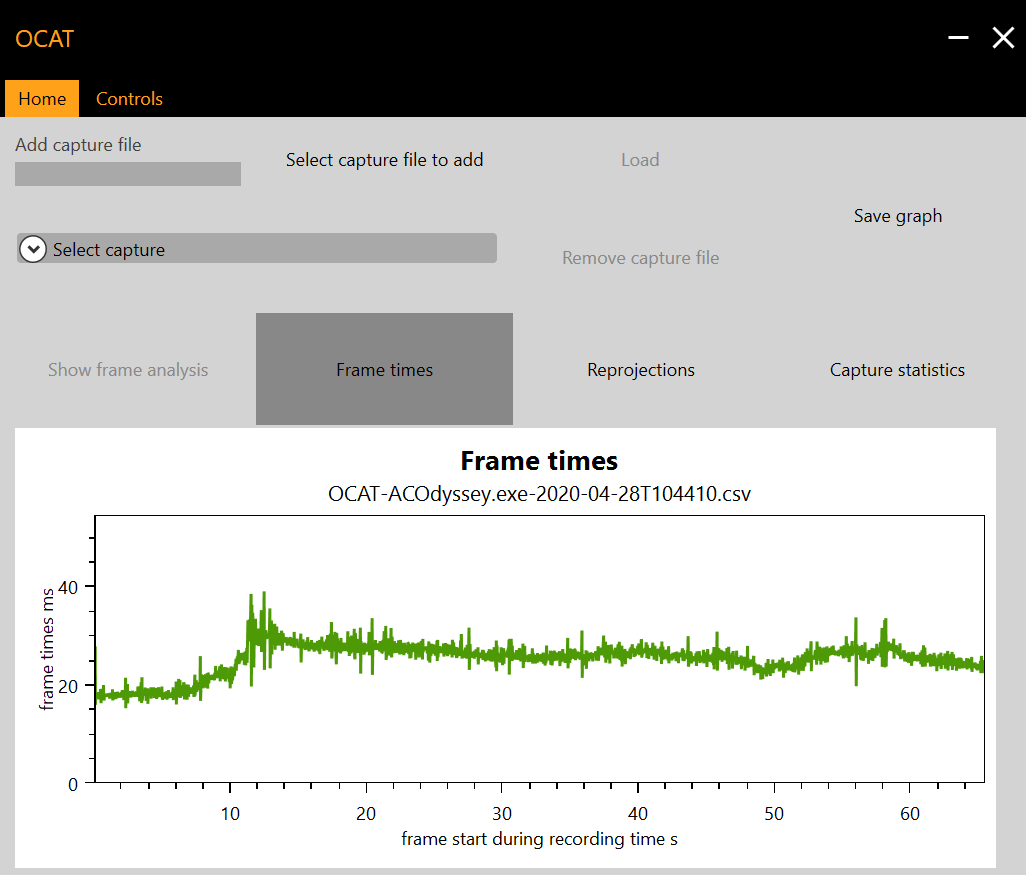
It might not look like it is smoothed, but 2629 data points were collected, and the graph would be much more messy if they were all shown. The lower the frame times, the better the performance is, so we can see that the benchmark starts at around at 18 milliseconds (which equates to 56 fps) before dropping to a reasonably consistent 26 milliseconds (38 fps) for the remainder of the test.
You can select more than one capture .csv file to analyze: simply load up one to start with, then use the ‘select capture file’ button again. This make it easy to compare frame times across different scenarios or games — for example, the image below shows readings from Milestone’s latest MotoGP 20 (the green line) and Shadow of the Tomb Raider (orange line).
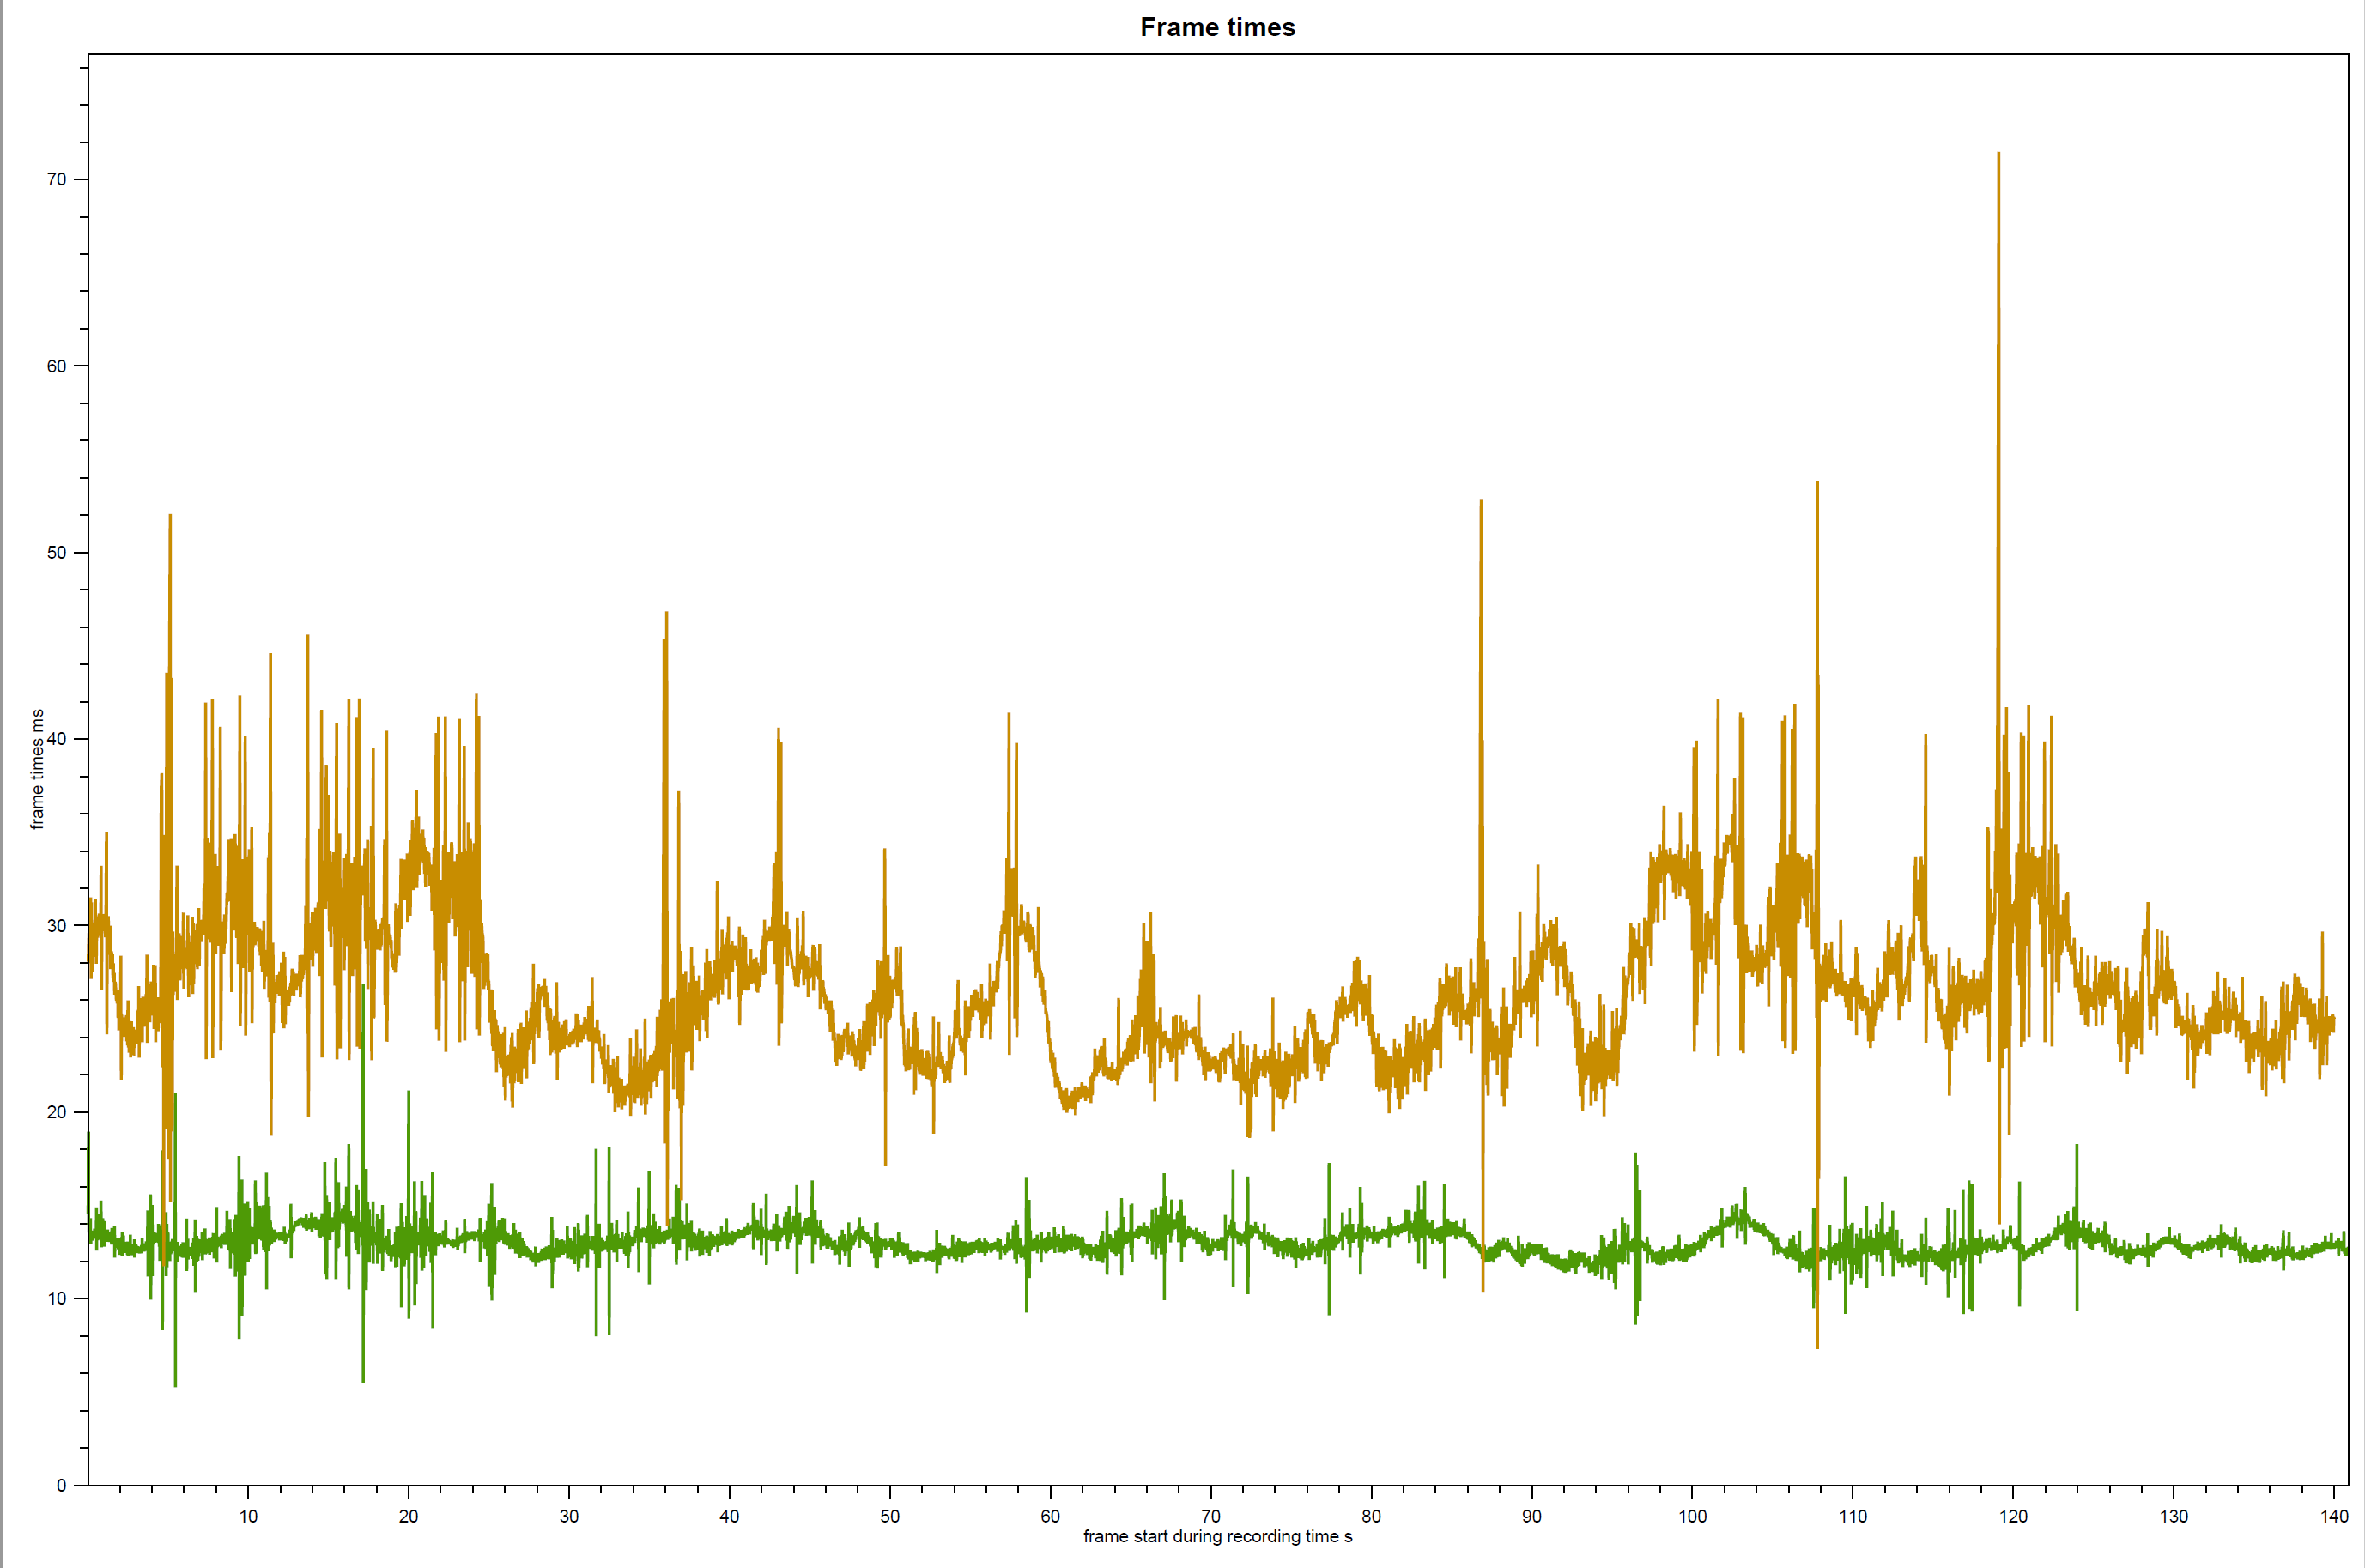
Both games were run at 4K resolution and with every graphics option set to its highest, which included using DLSS and ray traced shadows for Tomb Raider. We can see that this game is running slowly from the frame times, but also note how much the times bounce about. Compare that to MotoGP 20, where the frames take a very consistent 14 milliseconds.
As well as plotting the results, OCAT can do some basic statistical analysis for us. By clicking on the ‘Capture statistics’ button, we can see a variety of options. The two we’re after is ‘Average FPS’ and ’99th-percentile’. OCAT calculates the average frames per second (FPS) by working out the arithmetic mean of the MsBetweenPresents times. This is done by adding all of the collected times together, and then dividing the sum by the number of data points collected.
The conversion into the frame rate is the same as how we described it before: divide 1,000 by the times. So in this case, the mean MsBetweenPresents was 24.88 milliseconds, giving the following average frame rate:

The average FPS, by itself, paints a very poor picture of the data. This is because the average (in this case, the arithmetic mean) is just one statistic — specifically, it’s a measure of something called central tendency. This is a value that the sample of numbers tends to cluster around.
There are other averages, such as the geometric mean, the median, modal values, and so on. However, OCAT doesn’t calculate these, so if you’re interested in looking at other central tendency measures, you’ll need to examine the data with another piece of software.
AMD’s program does work out the 99th-percentile of the frame times. Percentiles are values that tell you about the distribution of the numbers, within the sample. And in the case of the 99th-percentile, the value is saying that 99% of all the frame times are lower than this time — only 1% of frame times were higher than this.
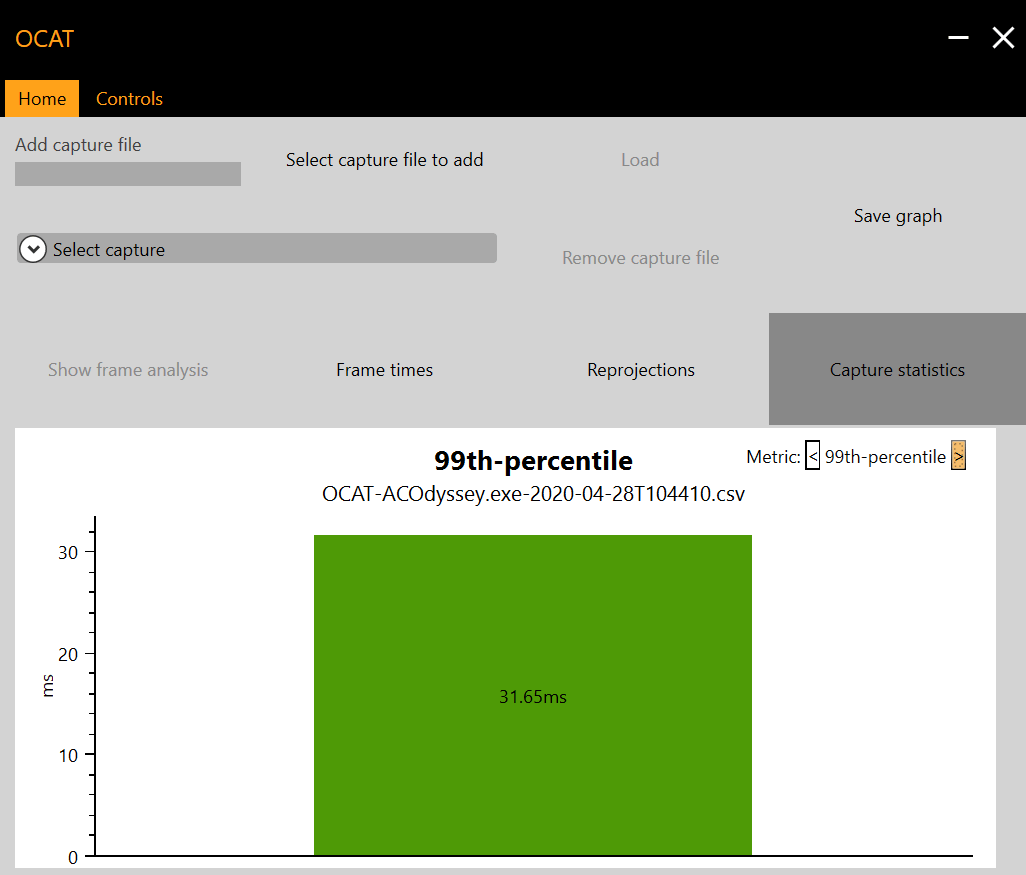
In our Assassin’s Creed test, the 99th-percentile was 31.65 milliseconds. Now, remember that the bigger the frame time, the slower the frame rate? So if we turn this into an fps value, we get the 1%-percentile for the frame rates and this comes to 1000/31.65 = 31.60 fps (coincidence, honest!).
In our hardware reviews, we call this the ‘1% Low’ value, and it tells you that 99% of the frame rate is higher than this number.
The average fps and 1% low are two, quick statistics that can give you a good insight into what’s going on behind the scenes in your computer. While the absolute minimum frame rate could be a lot less than 1% low value, it’s not occurring very often — just 1% of the time! If big drops in frame rate were taking place more frequently, then the 1% number would be lower.
But what if we want to tease out more statistics, or just do your own analysis? Well, CapFrameX can do vast array of statistics for you or you could write your own program in Python or R to do this. You’ve also got the option of using a spreadsheet program (such as Excel or Google Sheets) and for those, here are the functions you’ll need:
| Function | What it calculates the time interval is |
| =min(array) | Finds the absolute minimum in the array of data (the lowest number) |
| =max(array) | Finds the absolute maximum in the array of data (the highest number) |
| =average(array) | Calculates the arithmetic mean of the values selected (central tendency measure) |
| =geomean(array) | Calculates the geometric mean of the values selected (central tendency measure) |
| =median(array) | Calculates the median of the values selected — what value lies exactly in the middle of the numbers, when ranked lowest to highest (central tendency measure) |
| =percentile.exc(array,k) | Calculates the kth-percentile of the array selected (distribution measure) |
| =stdev.s(array) | Works out what the standard deviation of the array is, as a sample of the population (dispersion measure) |
The geometric mean and median just provide a different view of the average of the frame times — the former is best used where this a big difference in the times, and the latter is good for when the times tend to fall into several groups. For most people, the good ol’ arithmetic mean does the job.
We’ve already talked about percentiles but use the exclusive version, rather than inclusive, to ignore the very first and last data points. The capture process can often cause these to be lower than they should be, due to the game pausing for a fraction of second as the system enables the logging and then stores the recorded data.
Another useful statistic is the standard deviation. This value gives you a good idea about how consistent the frame times were, as it is a measure of the average gap between the individual times and the overall mean. The larger this value is, the greater the variation in the frame rate, so for smooth gaming, you’d want this to be as small as possible.
You don’t need all this mathematical information, though, to be able to dig into the PC’s ruminations during a game — the average frame rate and the 1% Low value are good statistics to work with. It’s about how you use the results!
Know Thy Enemy!
Time to put all of this information and knowledge into practice. The results from benchmarking your PC can tell you something about how what part of the computer is having the most impact on the game’s frame rates. Our test guinea pig had an Intel Core i7-9700K, 16 GB DDR4-3000, and GeForce RTX 2080 Super as its main components — so it’s fairly powerful, although there are faster/more capable parts out there.
To demonstrate a detailed analysis process, we used Assassin’s Creed Odyssey again, to see how its own benchmark tool is handled on the above system. We’re looking to make a judgement as to what kind of a test is it: does it push the CPU hard or is it all about the GPU? We’ll also compare these findings to figures collected from playing the game directly, which will give us an idea of how representative the benchmark tool is of actual performance behaviour.
With the game set to a resolution of 1080p (1920 x 1080 pixels) and the graphics quality at Ultra High, a total of 5 runs were recorded. Using a spreadsheet package, rather than OCAT, the frame times were averaged (with some other statistics calculated), then converted into frame rates, and finally plotted in a scatter graph.
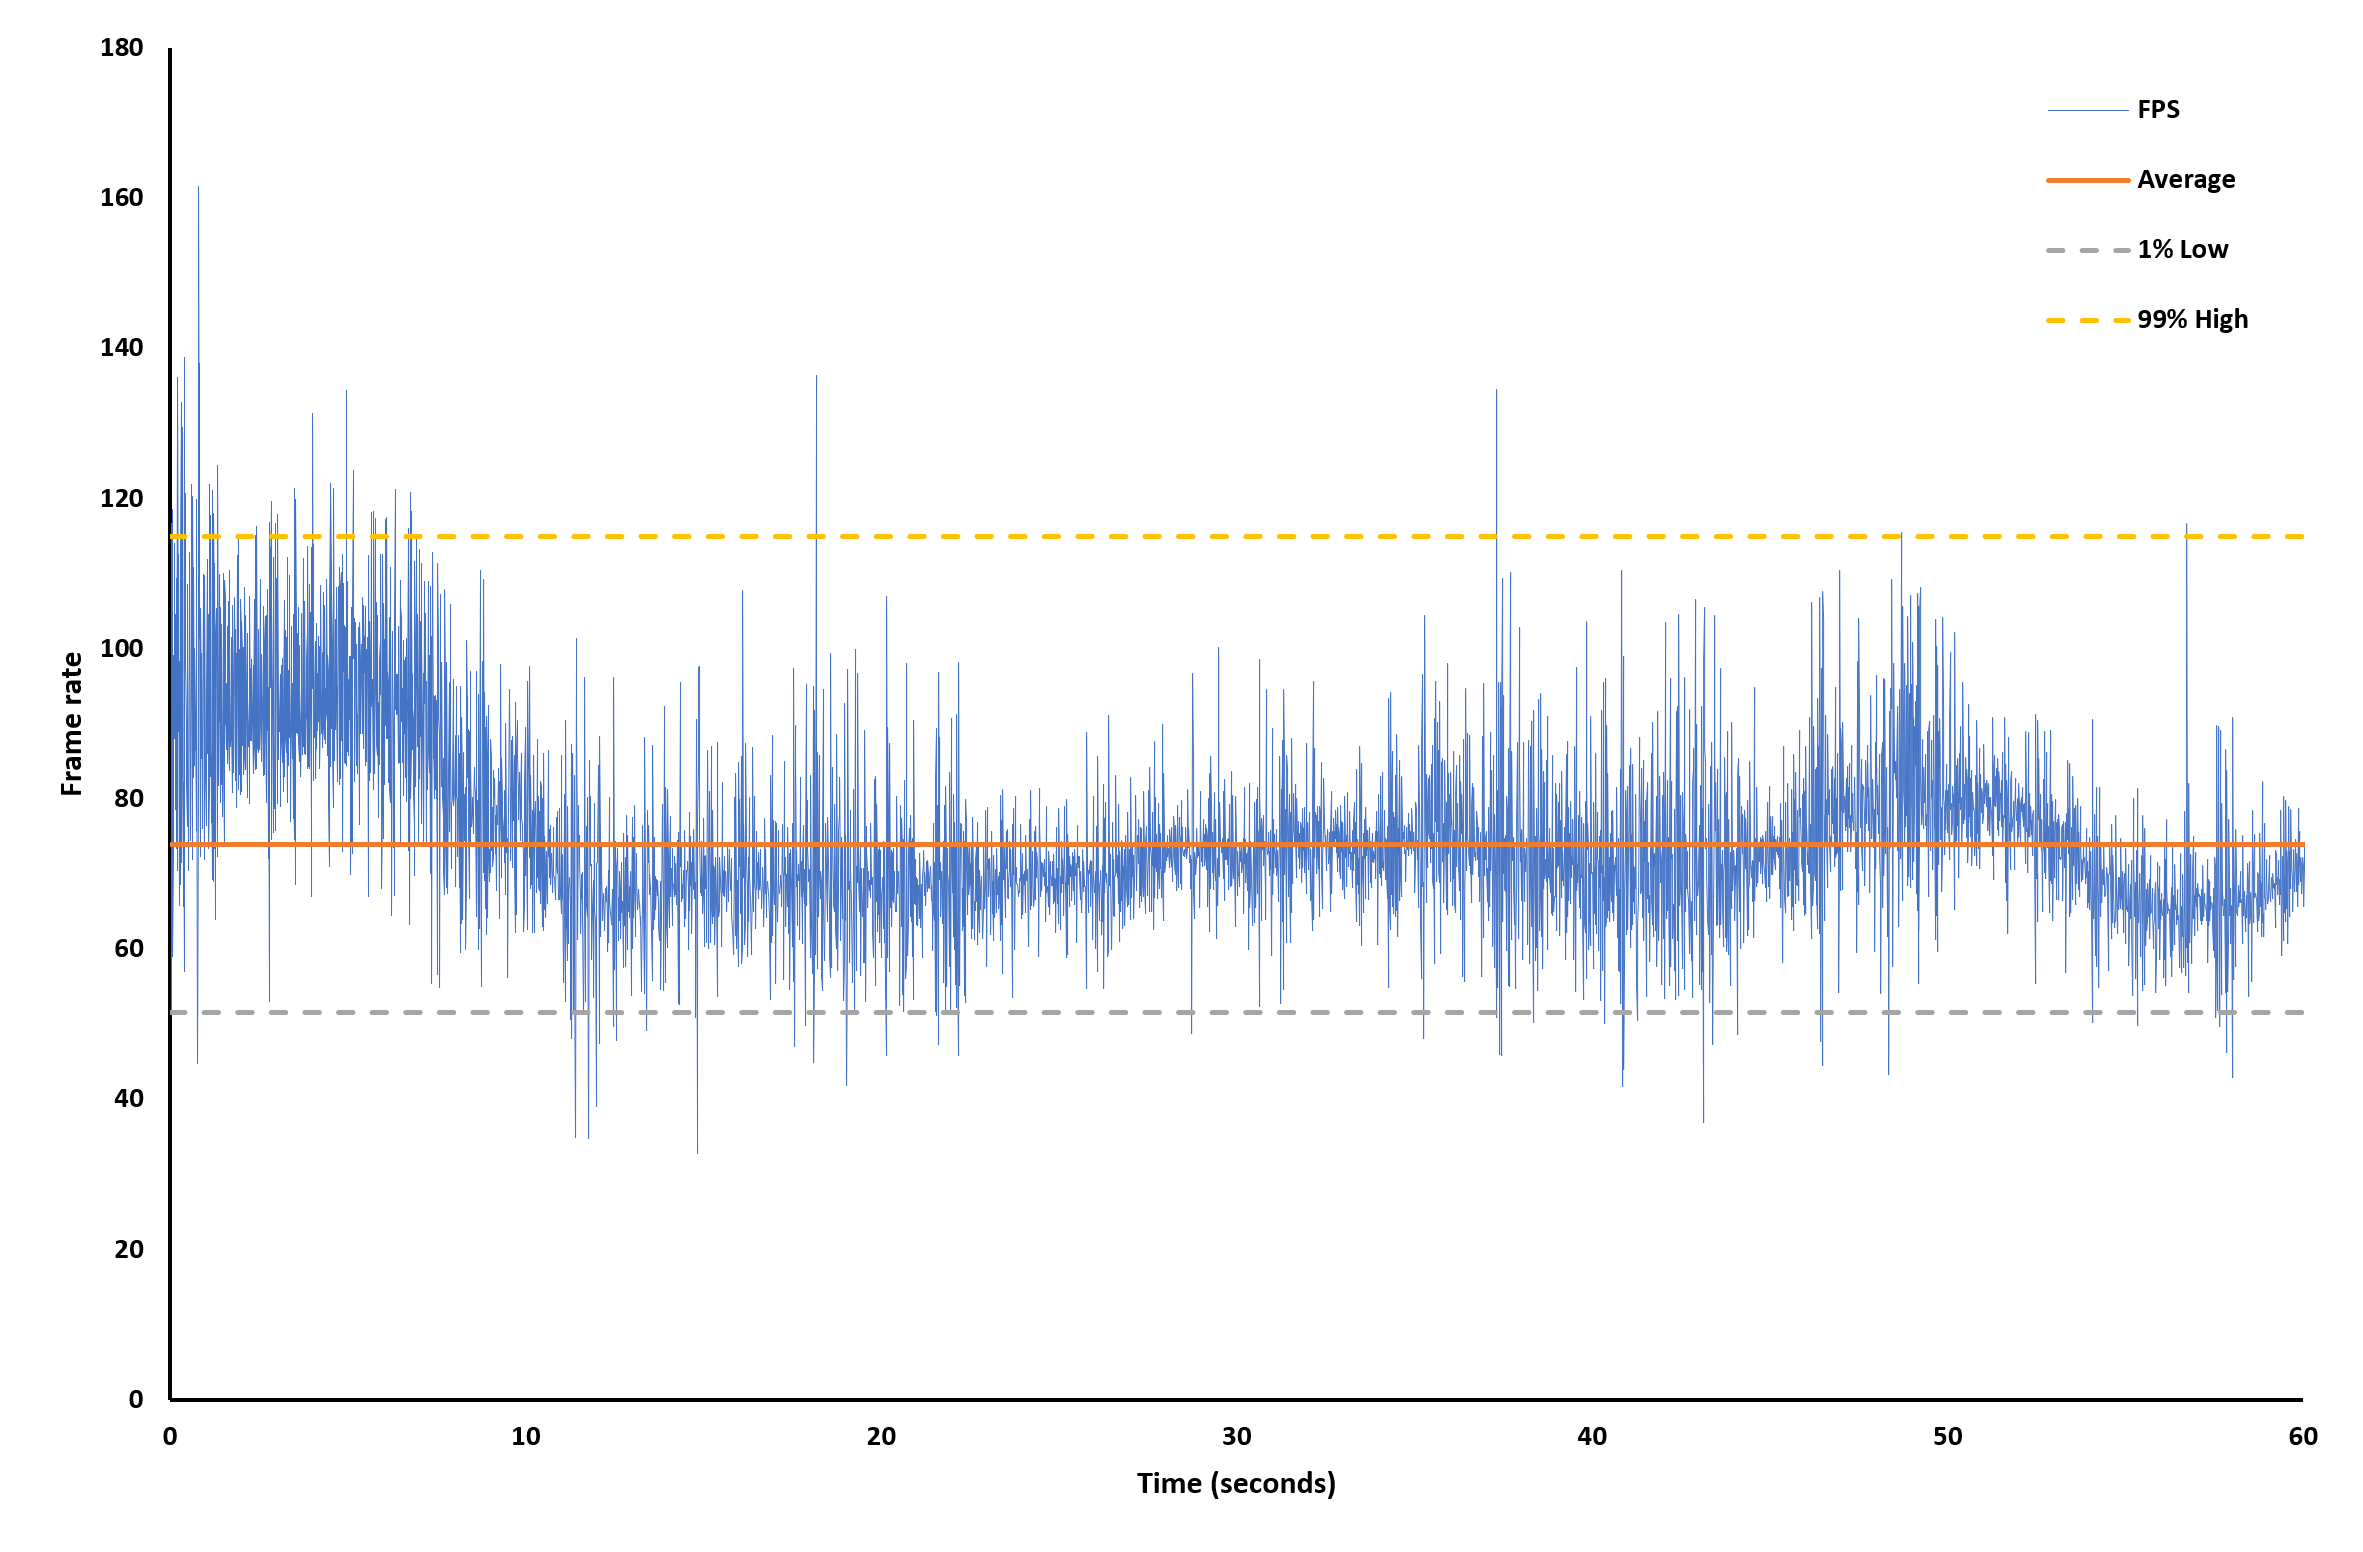
Now this might seem like the frame rate is bouncing about all over the place, and the test must have been a stuttering mess. But these rapid changes are separated by milliseconds and that’s far too quick to be directed observed. The overall impression of the test was that it seemed quite smooth.
The average frame rate is pretty good, at just under 75 fps, but that the gap between the 1% Low, 99% High, and the average are fairly large, around 22 fps and 40 fps respectively. This strongly suggests that the workload is quite intensive at times, and there’s one component within the PC that’s struggling with this: is it the CPU or the GPU?
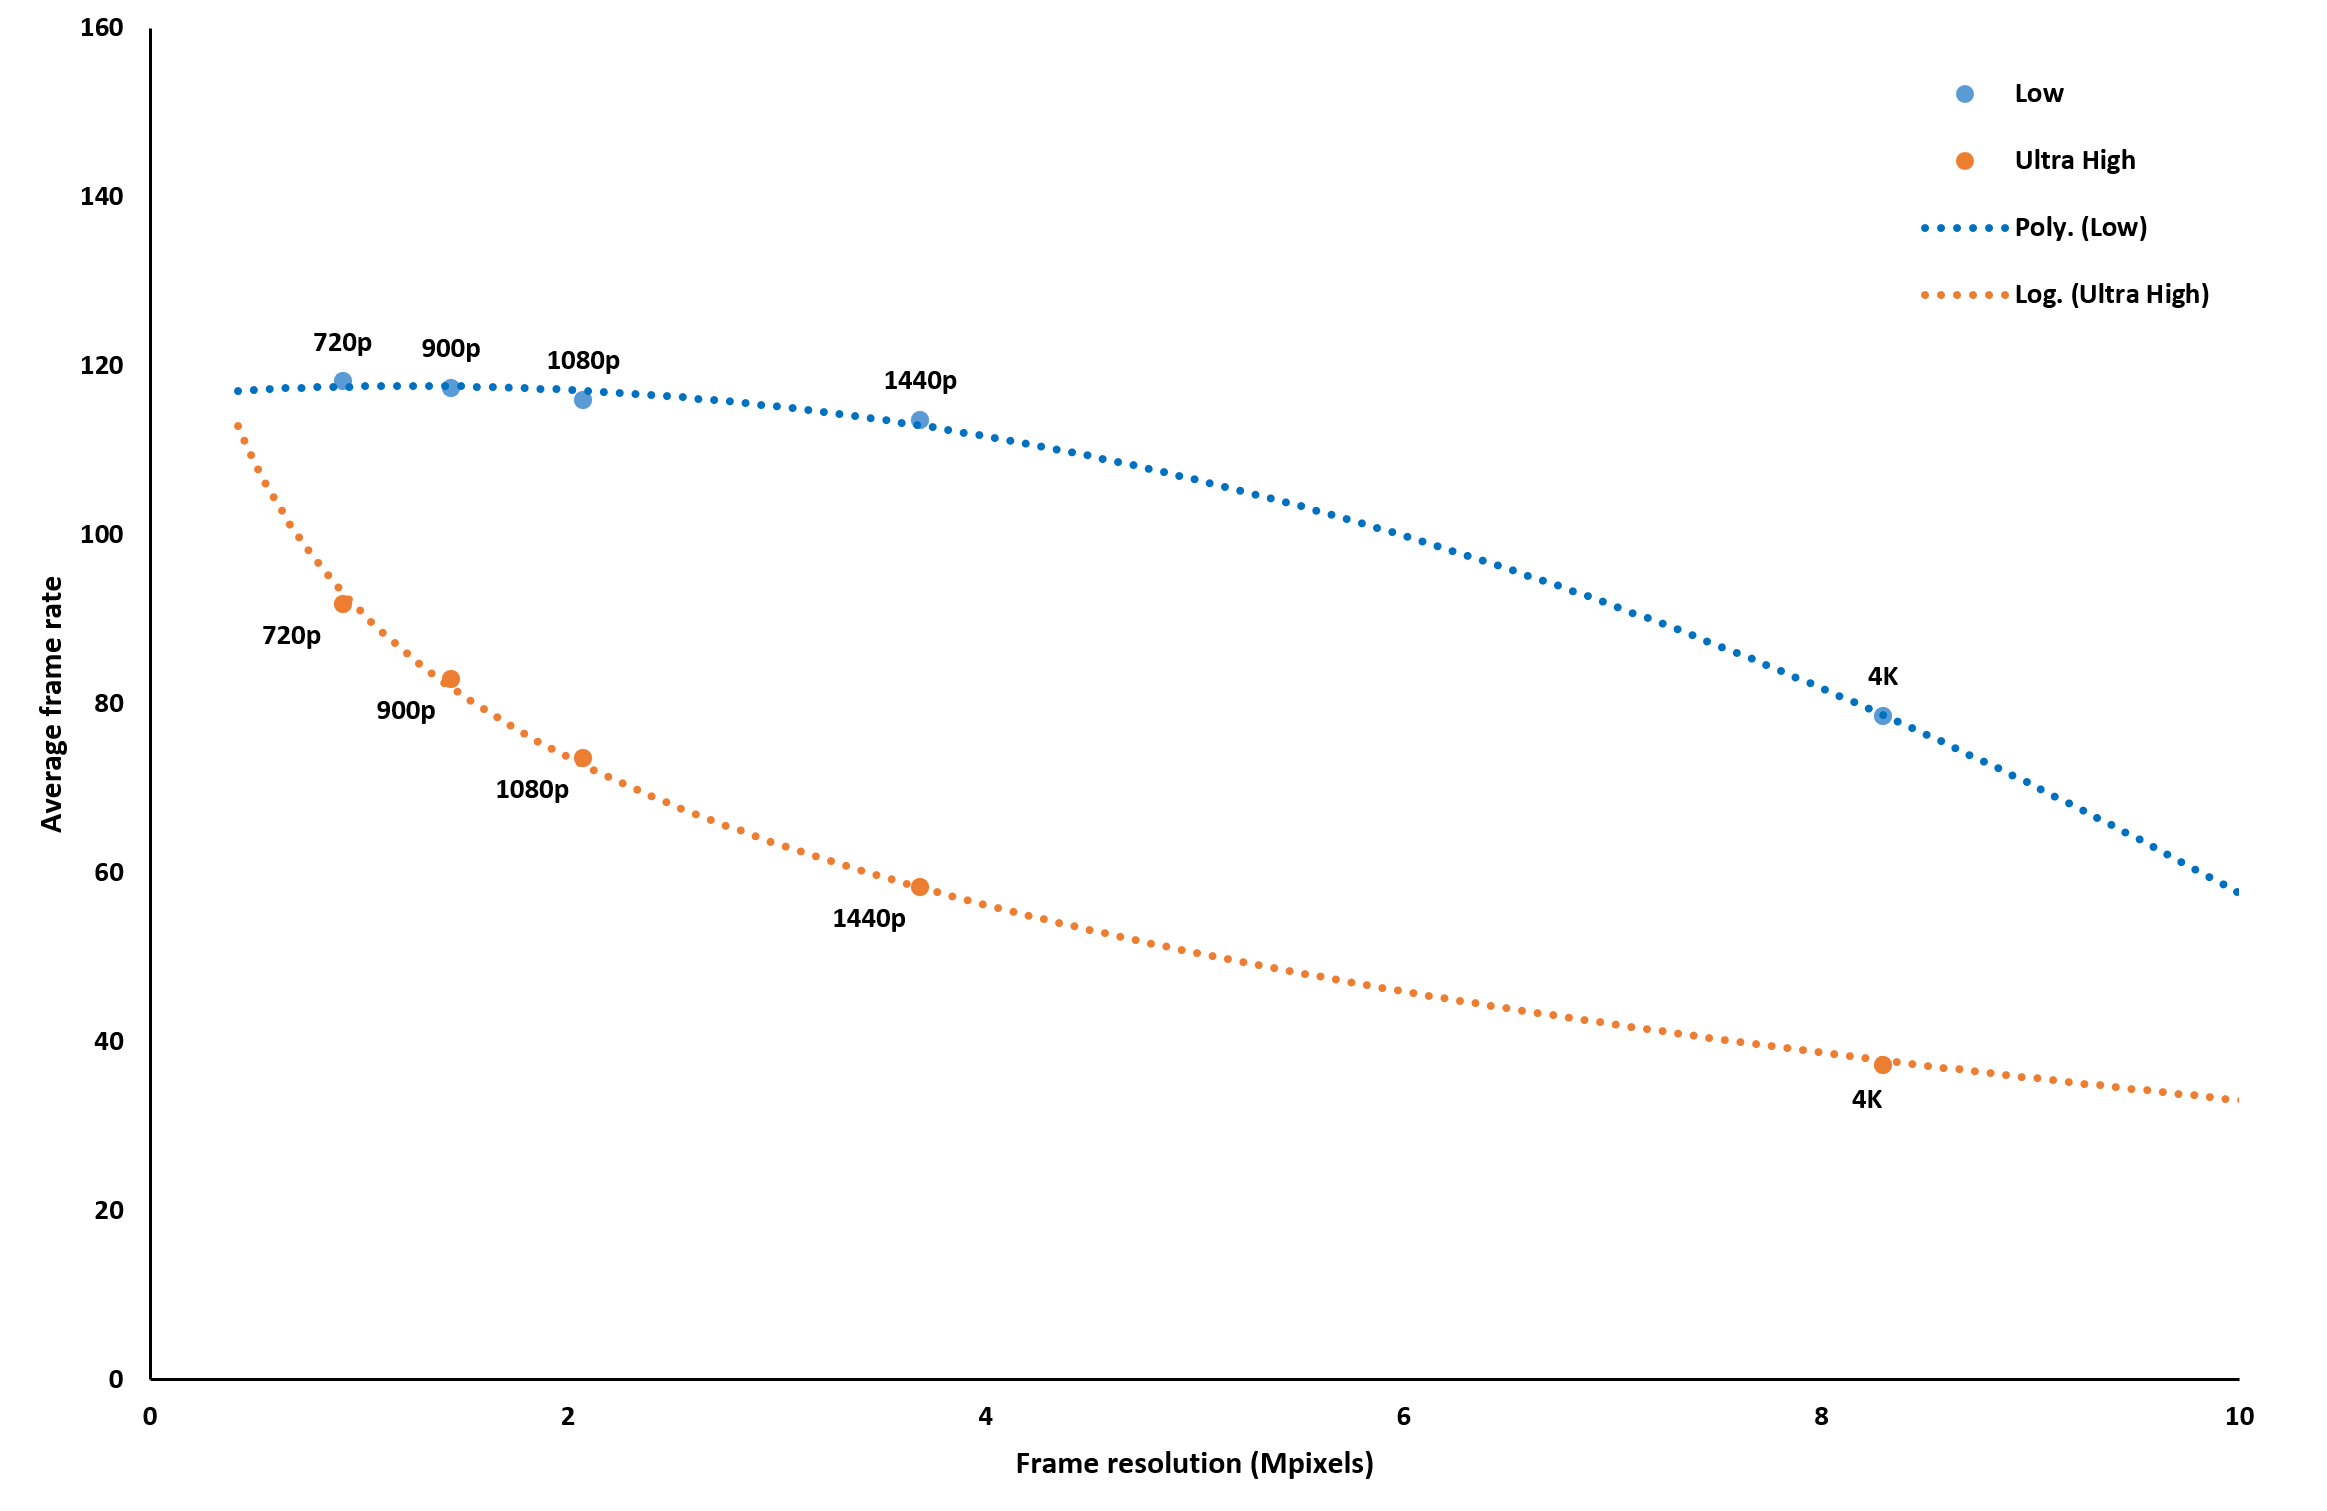
One way to examine this is to repeat the tests at different resolutions and graphics settings. Changing the former only really affects the GPU, whereas changing the latter will affect the CPU and GPU (although how much so, does depend on the game and effects are being run at the various quality levels). We picked 5 resolutions and used the lowest/highest possible detail levels.
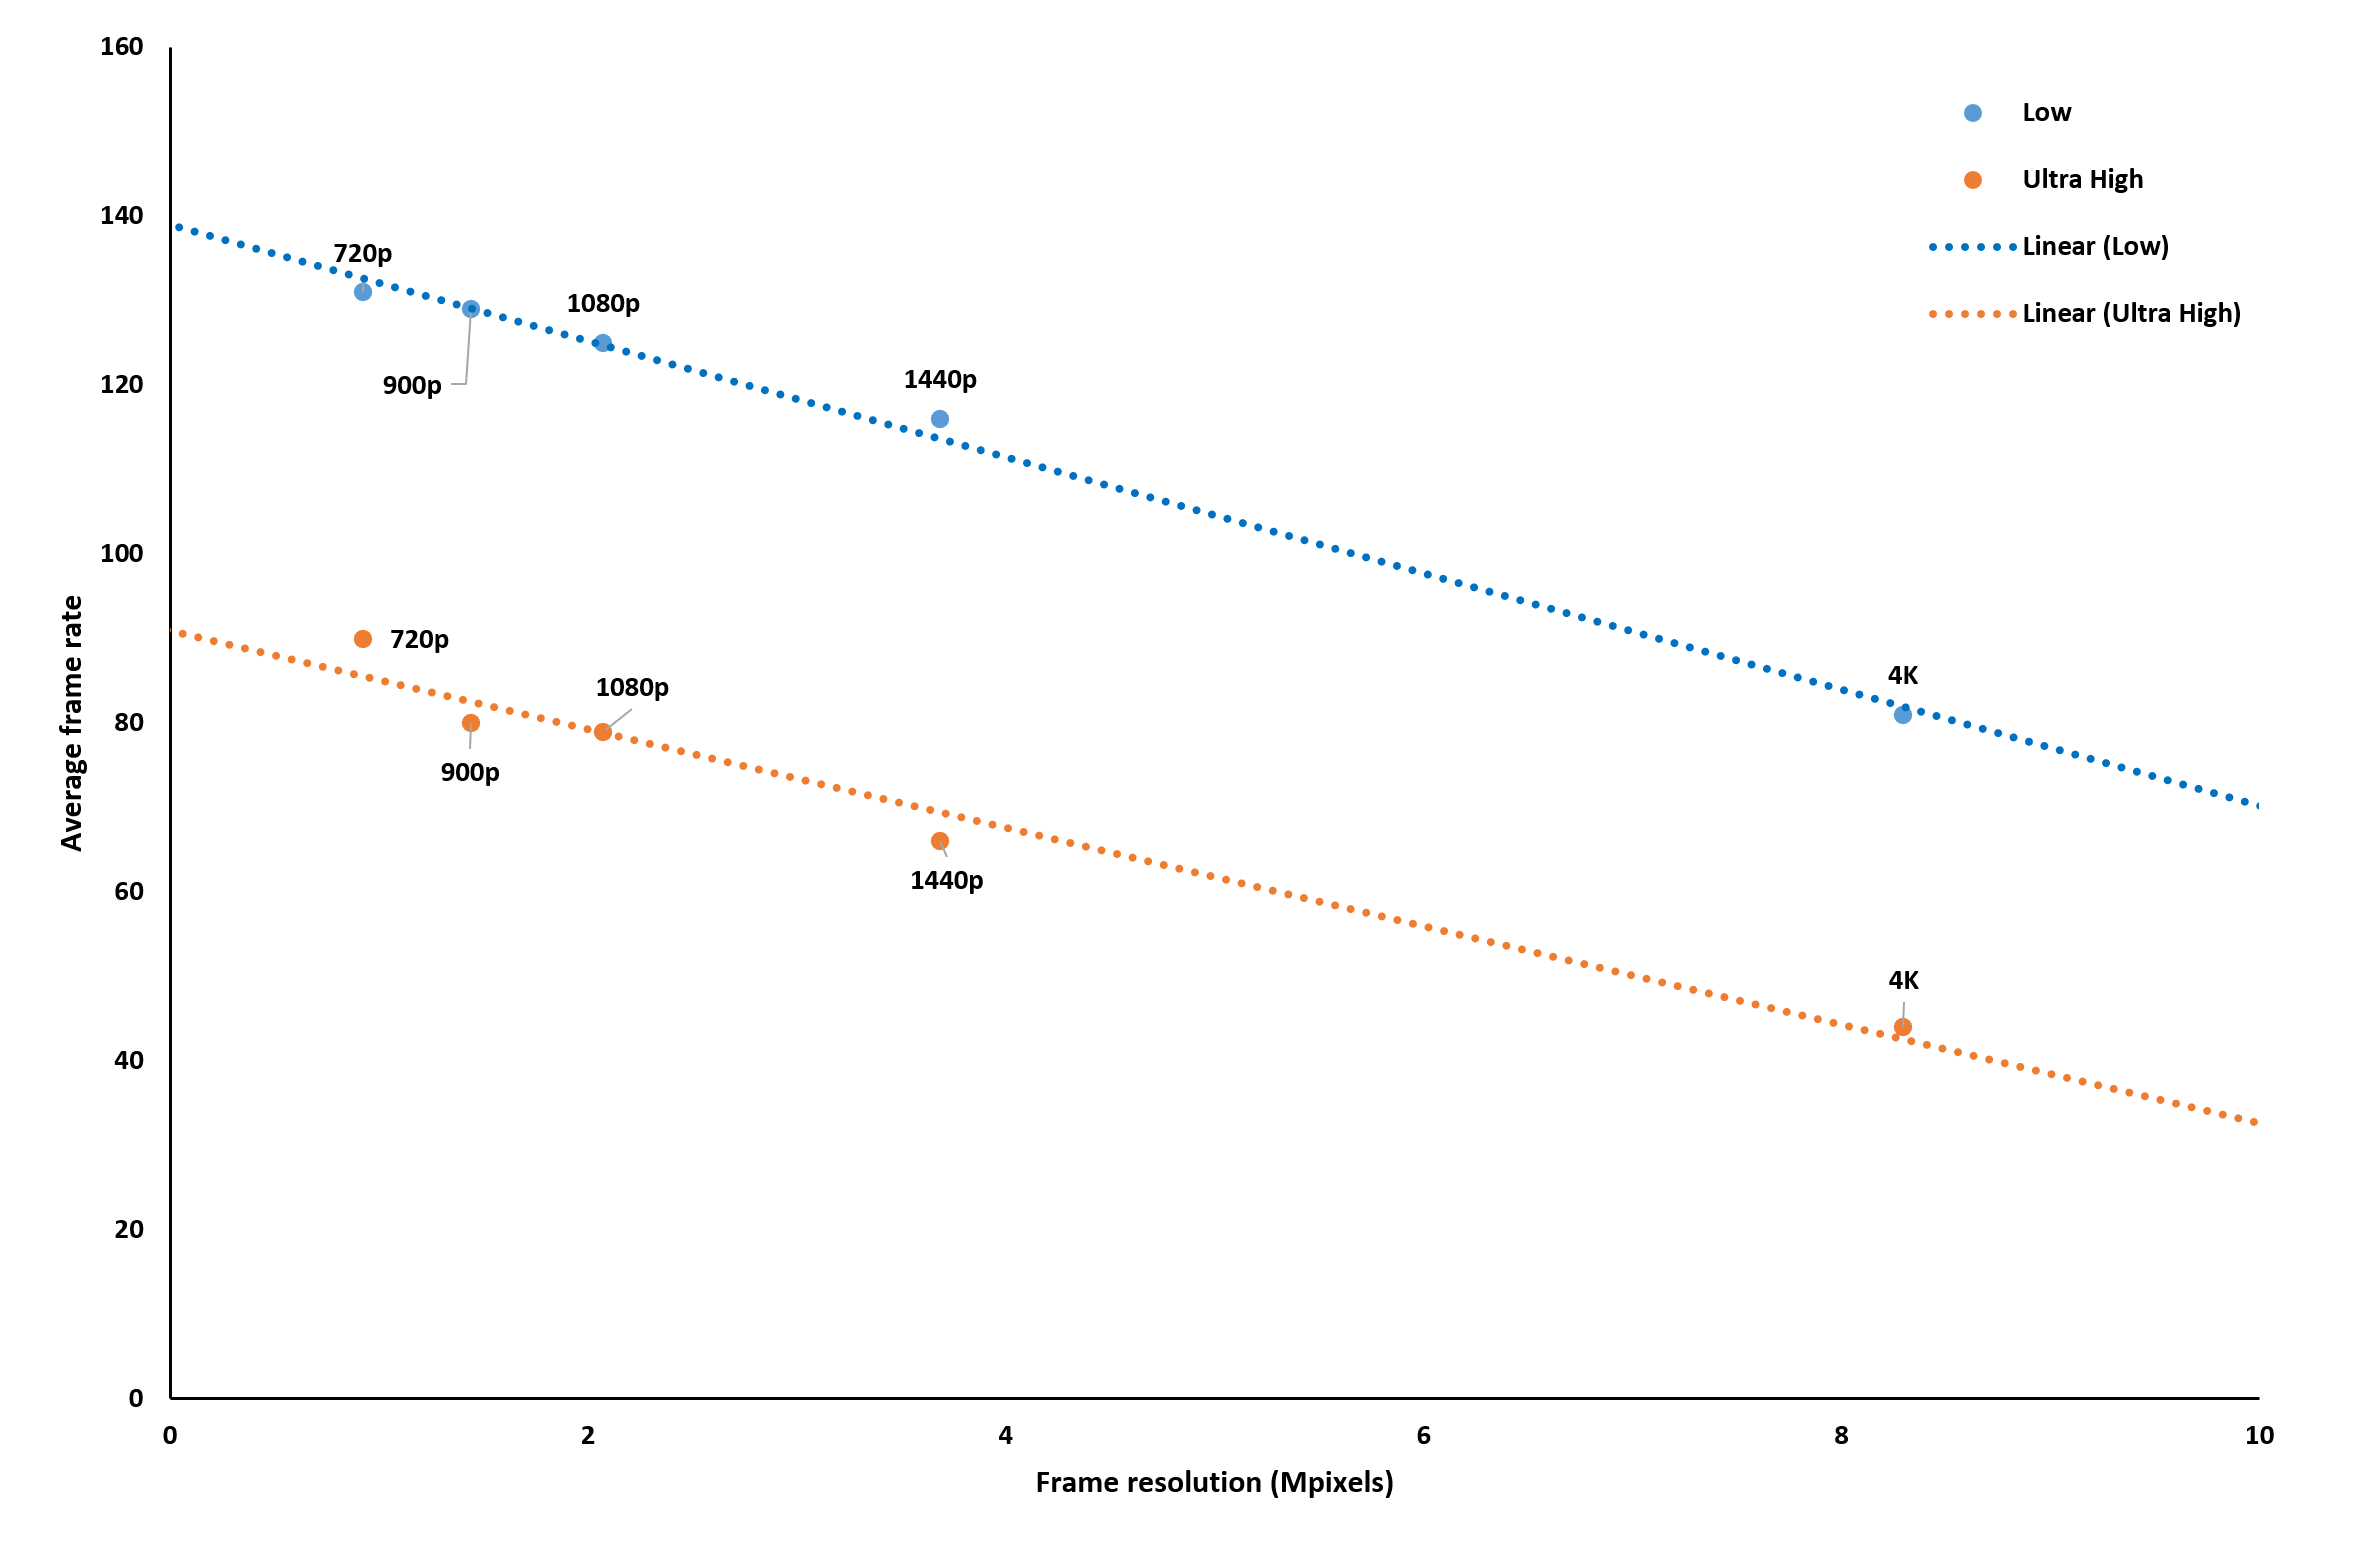
We’re only showing the average frame rates here, because the 1% Low values followed very similar patterns. At face value, these data wouldn’t seem to be telling us something we don’t already know: having more pixels to shade or using extra rendering effects results in a lower frame rate.
However, changing the resolution produces a linear change in the frame rate (as indicated by the straight trend lines). To see the significance of this, let’s compare this to the results we got running one of the graphics tests in 3DMark’s Fire Strike Extreme benchmark:
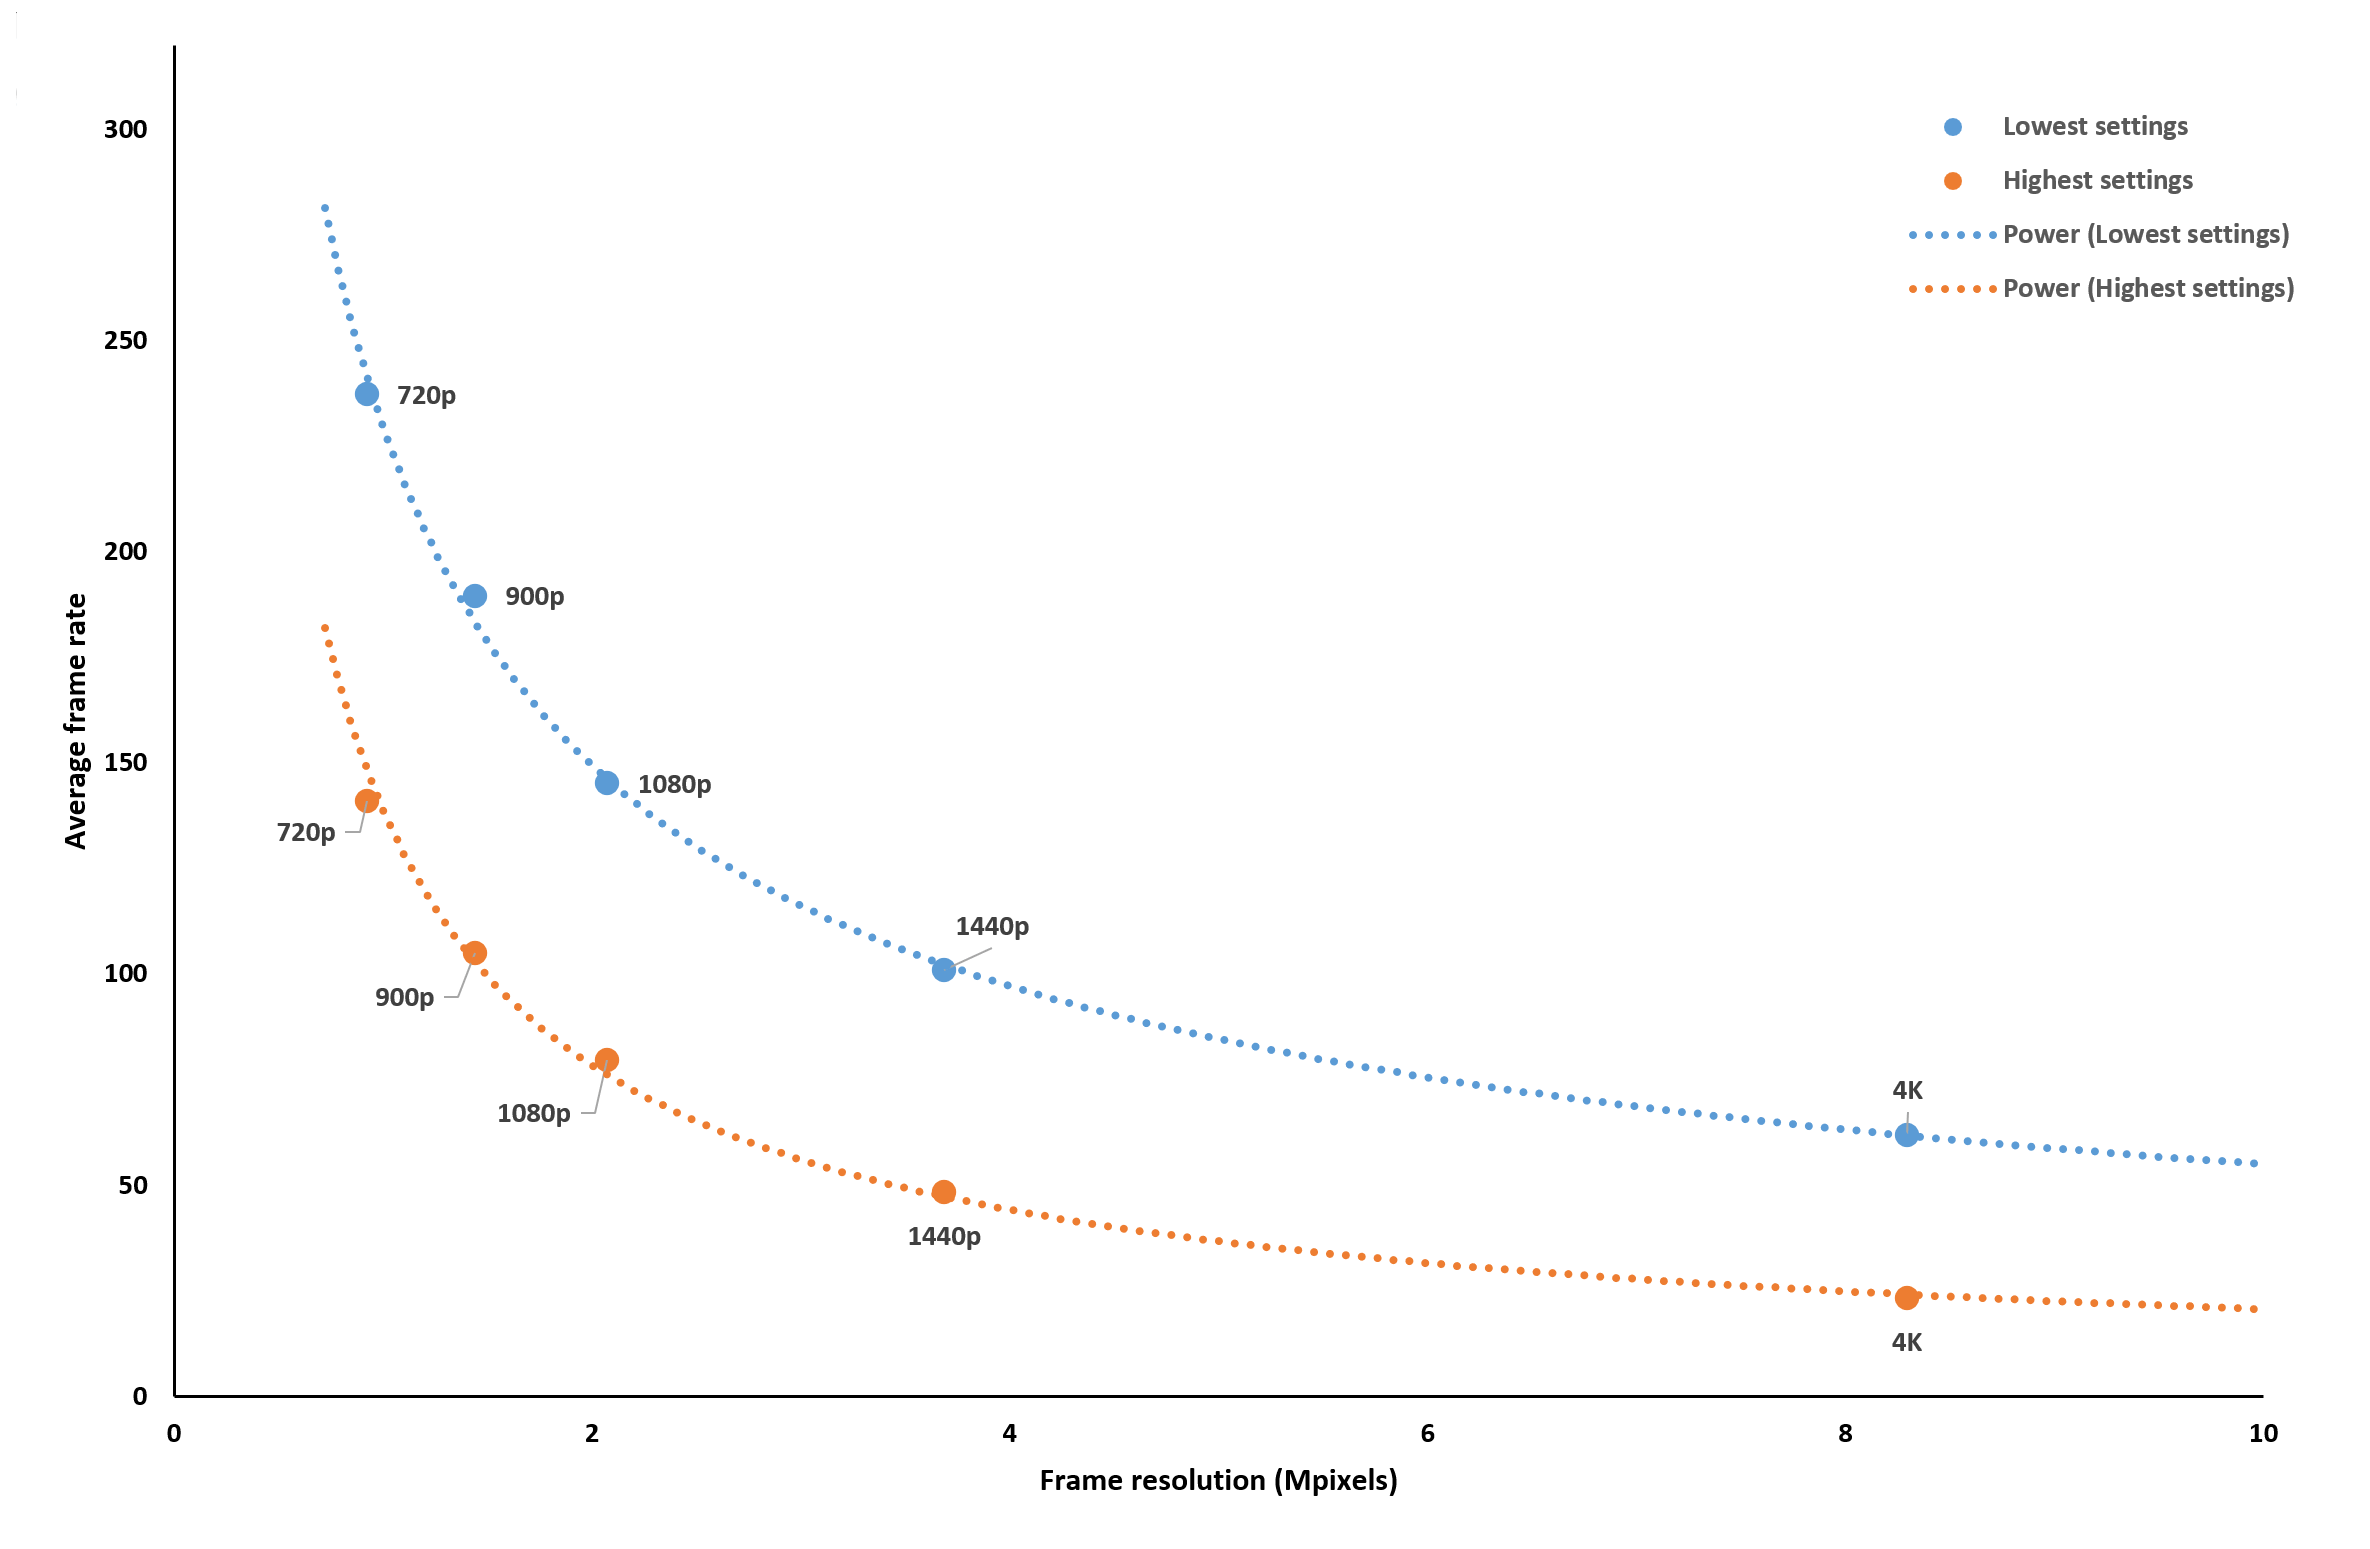
This test has deeply curving trend lines, which tells us that changing the resolution has a massive impact on the performance. In situations like this, the game/test is pixel bound — i.e. the graphics card is easily capable handling the shader calculations but as the number of pixels increases, the frame rate becomes limited by the GPU’s pixel output rate and memory bandwidth.
Think of it like a manufacturing line that produces a simple component at a fixed rate. If the production order wants 100 items, the line will get through these quickly, but if the order is for a few million, then it will take far longer to get it all done — even though each item doesn’t take long to do.
The straight lines seen in the Assassin’s Creed runs are indicating that this test is either compute bound or bandwidth constrained. In other words, there are so many long complex calculations for the CPU or GPU that the extra pixels don’t make a big difference to the workload, or there’s so much data to move about, the system’s memory bandwidth can’t cope.
Going back to the factory analogy, a compute bound scenario is where the manufacturing of the part is not affected by the size of production order, but by the complexity of it. A bandwidth constrained scenario would be a factory constantly having to wait for raw materials to be delivered, before it can get going.
We can figure out which situation we’re in, by altering one variable in the PC: the GPU’s core clock speed. Using MSI’s Afterburner, we locked the graphics card speed to a fixed rate and ran multiple tests over a wide range of clock values.
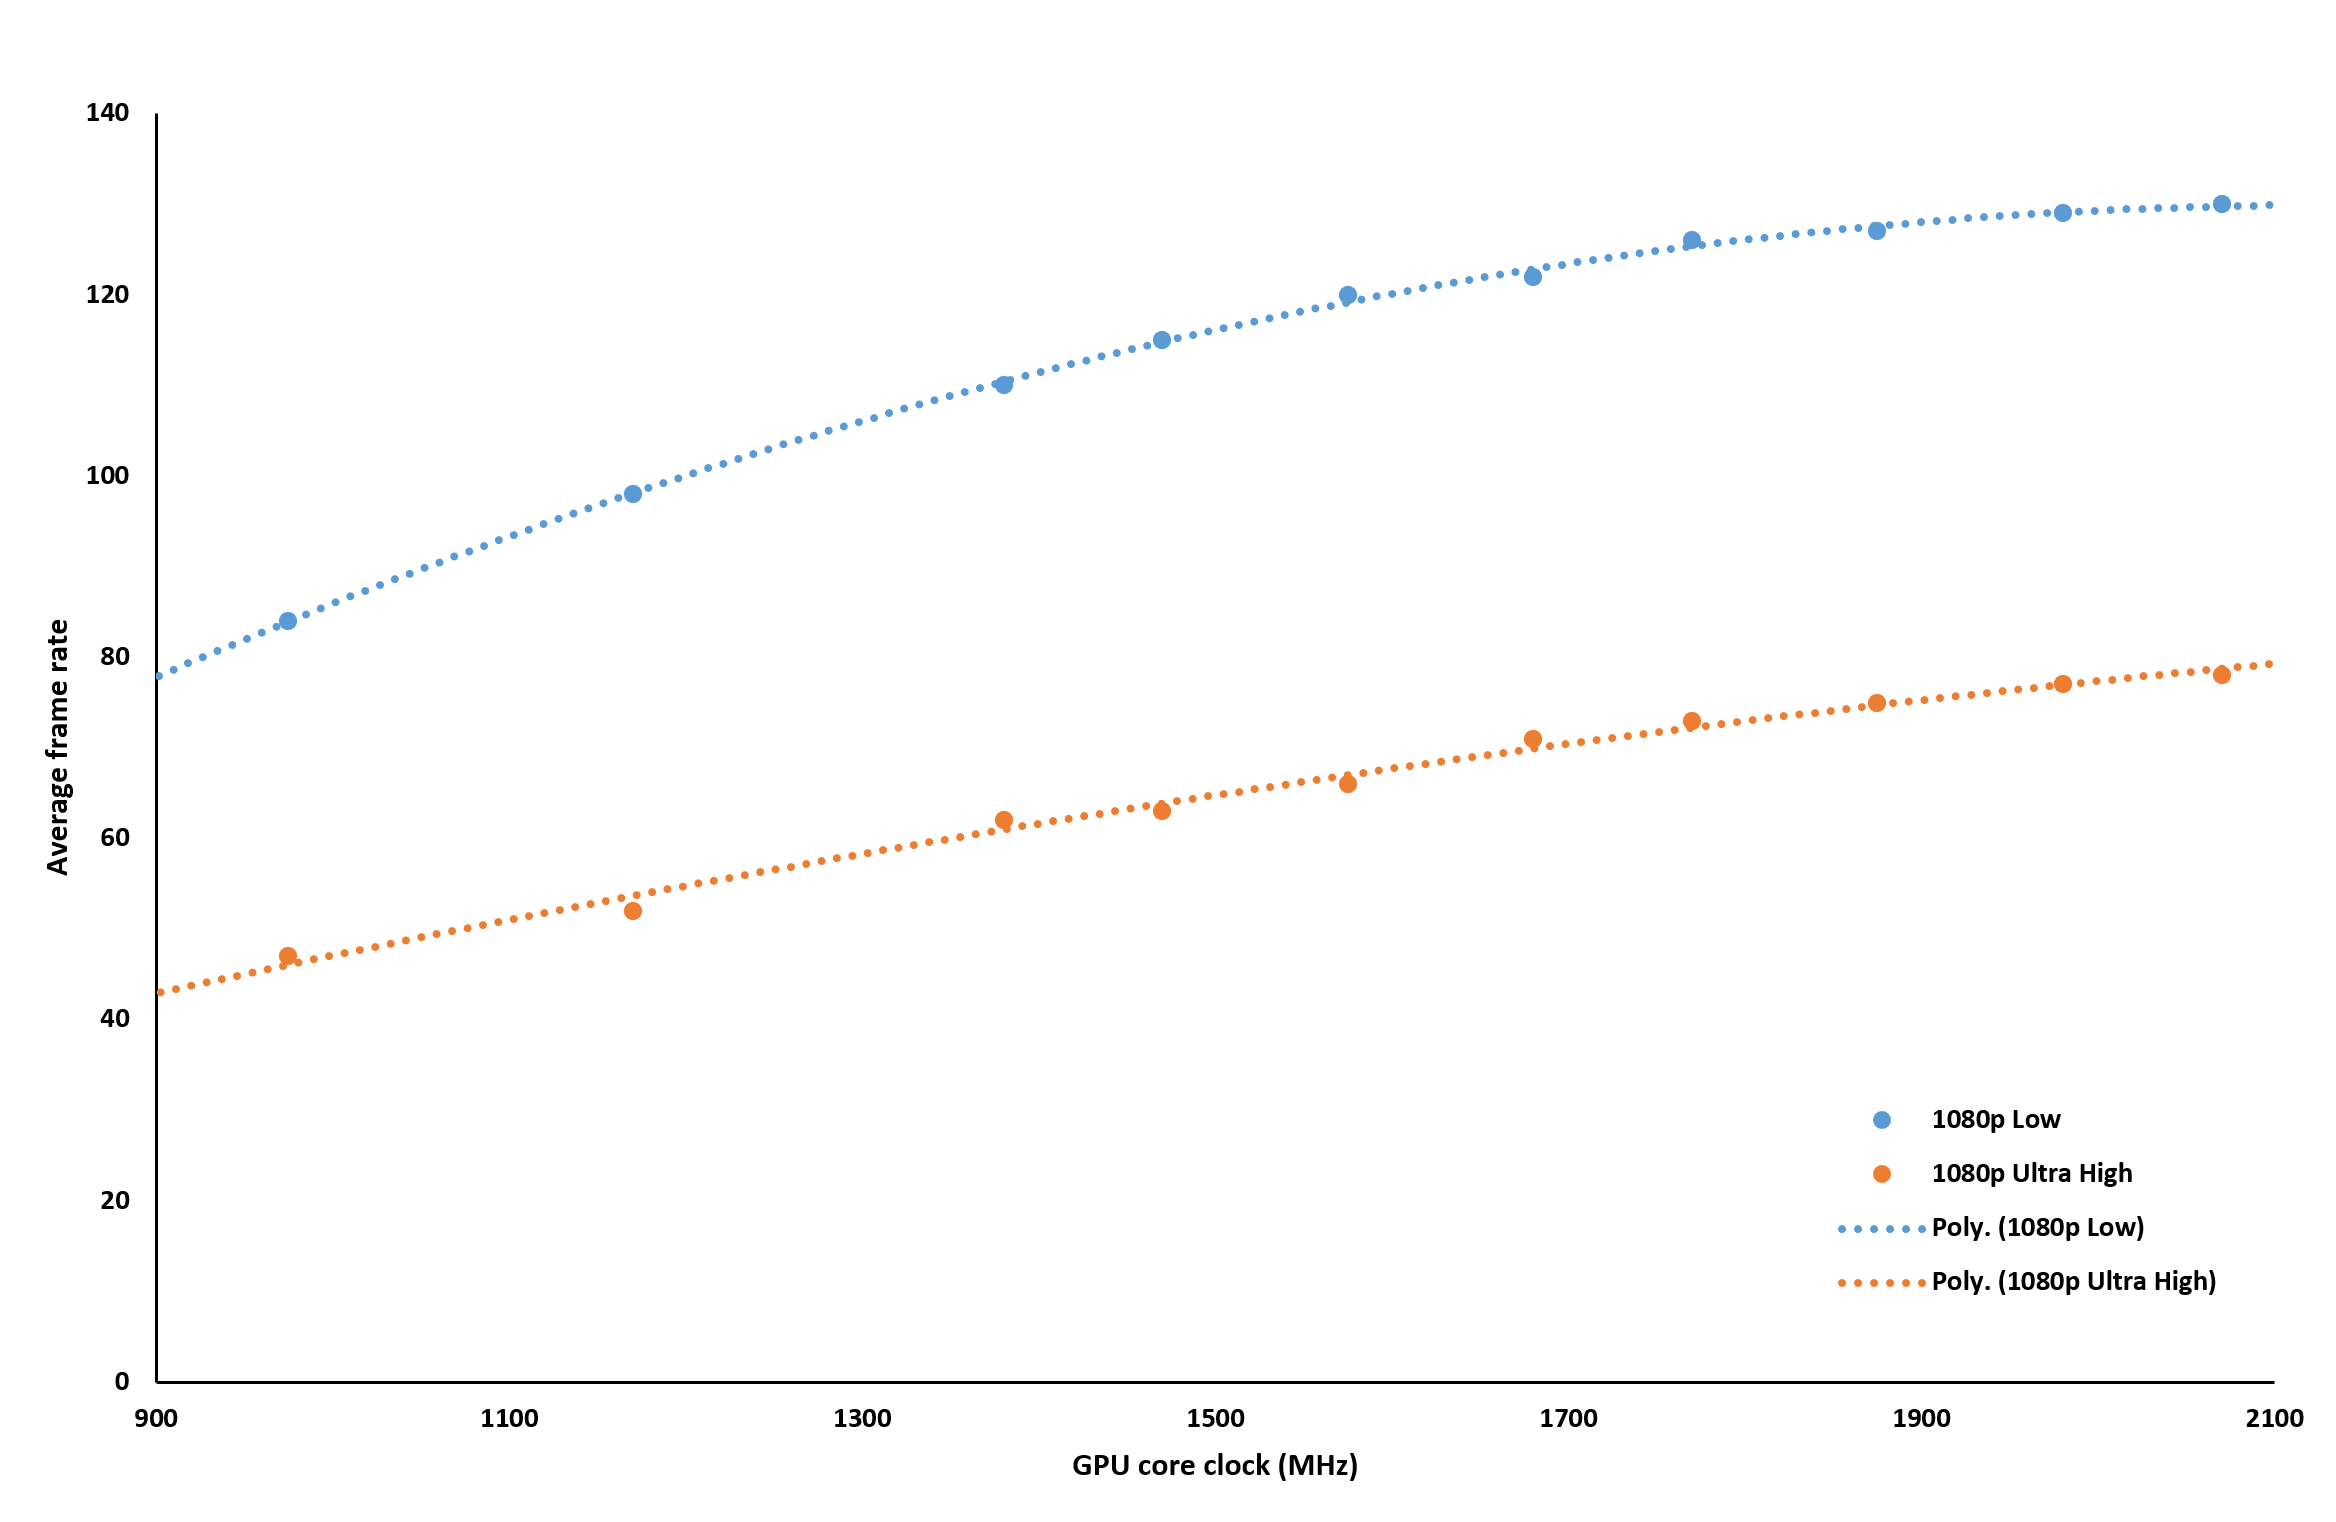
We picked 1080p for this examination, simply because it was the resolution in the middle of the five we had checked previously. Looking at the Ultra High trend line first, we can see that doubling the GPU’s clock almost produces a doubling in the average frame rate (the 1% Low was reasonably similar to this).
That’s not quite as big a jump as we saw in the 3DMark resolution checks, but it’s enough to suggest that the game’s benchmark is compute bound at these settings. Dropping the quality level down to Low gives us the same kind of pattern, but the fact that it’s more curved and it only flattens at around 1,900 MHz, is more evidence that the benchmark’s workload is heavily loaded onto the GPU.
At this point we could have run further tests with the graphics card, altering its memory clocks, or done the same with the system memory, but with the evidence suggesting that it was a compute issue, and not a data one, we turned to looking at confirming exactly where in the processing chain the load was.
To do this requires altering the CPU’s clock speeds and we used Intel’s Extreme Tuning Utility to do this, forcing all of the cores in the processor to run at the same, constant rate. If your system is unable to do this, then unfortunately it’s a check that’s unavailable to you

At 1080p, with Ultra High settings, altering the CPU speed over a range of 1.4 GHz barely made any difference. This clearly tells us that our test PC was indeed compute bound and that this roadblock was entirely at the GPU.
In fact, we had to go all the way down to 720p, with graphics details at their lowest, to see any significant change in the frame rate, with CPU clock speed.

The fact that the trend line is starting to flatten off at around 5 GHz, the same region as the CPU’s default speed, tells us that the built-in benchmark in Assassin’s Creed Odyssey is very much a graphics card test. Why? Because the CPU’s performance only impacts on the test outcome when the GPU is given the least amount of work possible.
So that’s the test analysis done and we have enough information to be confidence in saying that the game’s own benchmark pretty much just tests the graphics card, no matter what settings are used. But how does all of this compare to what happens when you’re actually in the game? Let’s repeat the resolution tests again:
To start with, the frame rates themselves are lower in the game, than we found in the benchmark, but notice how different the trend lines are? At the lowest graphics settings, the performance is essentially the same at 1080p, as it was at 720p — the line is pretty flat between these resolutions. Only with more pixels than this, do we see the fps decrease. The 1% Low results also followed this trend, just as we found in the benchmarking tool.
This tells us that the GPU easily copes with the work, so the performance of the game is being determined by the capabilities of the CPU. Switching to Ultra settings reverses this pattern, and we see a curved trend line, just like saw in the 3DMark test. It doesn’t dip as much as in Fire Strike Extreme, but it’s enough to indicate that, with these graphics levels, the game is somewhere between being compute and pixel bound.
We re-examined the effects of GPU and CPU clock speeds at Ultra and Low settings and essentially found the same patterns as before — all of this strongly suggests that Assassin’s Creed’s benchmark is definitely a graphics card test, but it is a reasonably good indicator of what to expect in the game itself.

Big caveat time, though — this is true for this PC, running this particular test, only. It cannot be stressed enough that with less or more capable hardware, the results would be different. A stronger GPU would cope with the compute load better, meaning the CPU would have more sway in the average frame rates, whereas a weaker GPU would fully control the performance.
But whatever system or game is used and checked, the test routine we’ve just gone through can be applied to any situation, be it in-game or in-benchmark. Let’s summarize the overall process, so it’s easier to follow and repeat with your own PC:
- Set the game’s graphics details and resolution to the highest the PC will support
- Capture several sets of data and average the results
- Repeat the tests a few times, lowering the resolution for each set
- Plot the findings in a graph: straight lines indicate the game is compute bound (CPU and/or GPU), curves suggest pixel bound (GPU only)
- Pick a resolution and retest, but change the GPU clock speeds
- Plot these results: if the trend is constantly up, then the GPU is limiting the frame rate; if the trend line flattens off, then it’s the CPU
- Repeat once more with CPU clock changes (if possible) to confirm the above
This is clearly a lot of work, and this is why testing hardware for reviews takes so much time and effort! However, you can do a simplified version, where the only thing you change is the GPU clocks — set up the game to how you normally have it, and use a tool to drop the speed of the graphics card in stages. Large changes in the average or 1% low frame rates will indicate that it’s the GPU that’s the limiting factor in the game’s performance; if slicing off, say, 25% of the graphics card’s speed doesn’t make much difference, then it’ll be the CPU that’s controlling matters.
Windows will now shutdown
If PCs were like consoles, none of what we’ve been going through would be worth doing (or possible, for that matter). This is because the range of different hardware and software configurations out there is very small. Game developers have a far easier job of ensuring their projects work properly on the Xbox, PlayStation, or Switch than with Windows-based computers.
And it’s not hard to see why, when you look at all the different CPUs and GPU models that can be purchased — for example, Nvidia offers nearly 60 products that use their Turing processors and AMD has over 50 CPUs sporting the Zen architecture. Not every combination of the two would be used for gaming, but the count still runs into the thousands, and that’s without throwing other processor models, RAM, motherboards, storage, operating systems, and drivers into the mix.

It might seem like it’s nothing short of a miracle that developers manage to get their games to work at all on PCs, but they do it by generalizing their approach to how their code is going to run and what hardware support is required. This means there’s always some room for improving a game’s performance, but it also means that there’s a good chance that a particular title might not run well on a specific setup.
This is why using games to benchmark hardware and sharing the results with the world can be so useful — no game developer has direct access to all of the possible hardware configurations, but through our and your hard work, they can collate the information and use it to continually improve their work. Well, theoretically they can!
Of course, in-depth benchmarking and data analysis isn’t everyone’s favorite flavor of ice cream; it can often be tedious to do and it rather misses the whole point of having PC games in the first place (i.e. play them!). But we hope this article has given you some insight as to how we test hardware and how you can do the same. And if you’re wondering about what part of your PC to next upgrade, this is a great way of getting the numbers to help you make that decision.
If you have your own method of testing hardware or know about some neat logging tricks, share them with everyone in the Comments section below.
Tests done, stats calculated, data analyzed — time to shutdown Windows!
Download: 20 Programs to Analyze and Benchmark Your Hardware
Don’t Miss: How We Test: CPU Gaming Benchmarks — or: How I Learned to Stop Worrying and Benchmark Using a High-end GPU